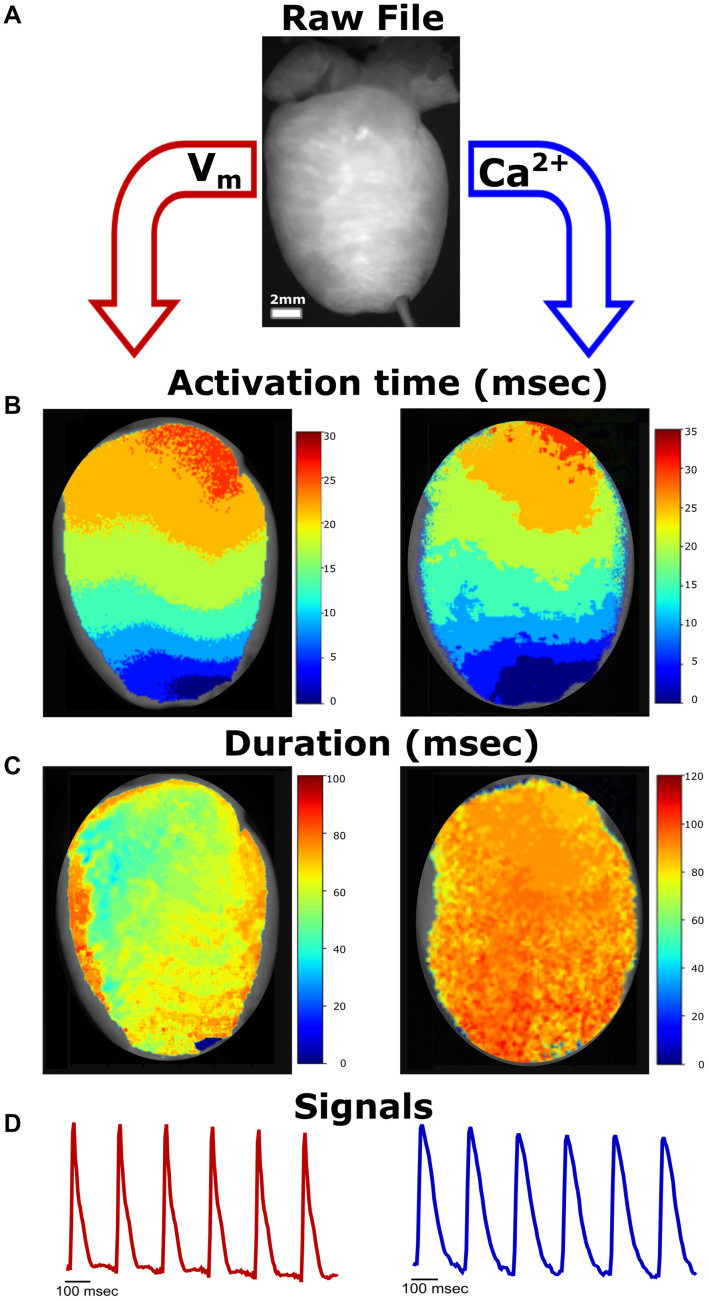
FIGURE 1.
Simplified Workflow. (A) Representative raw image file from a Langendorff-perfused rat heart study (*.tif stack). Image properties (e.g., frame rate) are defined by the user. In our experimental setup, voltage and calcium signals can be analyzed from the same heart preparation. (B) Activation maps generated from raw image file demonstrate propagation away from the pacing electrode at the apex (left—voltage, right—calcium). (C) Generated action potential duration (left) and calcium transient duration (right) maps. (D) Representative traces from the raw image file.

