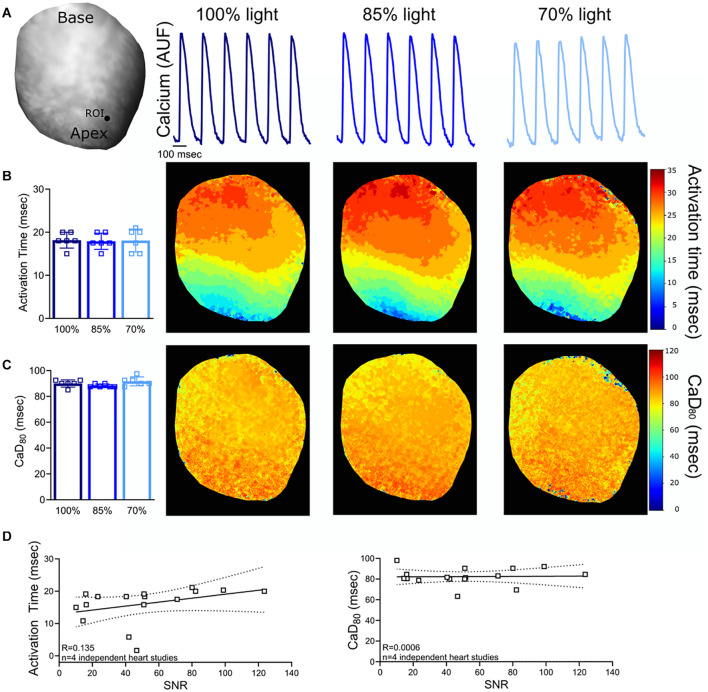
FIGURE 3.
Calcium Signal-to-Noise Ratio (SNR). (A) Representative rat heart loaded with calcium dye, Rhod-2, AM. Calcium transients were analyzed from the same region of interest (ROI) on the epicardial surface (n = 6 calcium transients, same heart with diminished light intensity). (B) No measurable change in activation time was noted when the excitation light intensity and SNR was reduced (n = 6 calcium transients, same heart). (C) Calculated CaD80 values also remain unchanged (n = 6 calcium transients, same heart). (D) Relationship between SNR and calcium transient measurements (n = 4 optical signals collected from n = 4 independent heart studies). Epicardial dynamic pacing (160 ms PCL) from the apex of the left ventricle.

