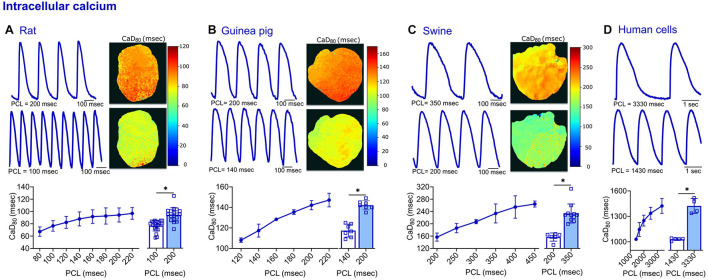
FIGURE 5.
Calcium transient measurements acquired from four different species. (A) Representative signals and CaD80 maps from a rat heart paced at 200 and 100 ms PCL (top). Compiled restitution curve of CaD80, in response to dynamic epicardial pacing (bottom left, n = 11–19 independent heart preparations). Longer CaD80 values observed at slower rates (200 vs. 100 ms PCL, n = 18–21 independent heart preparations). (B) Representative signals and CaD80 maps from a guinea pig heart paced at 200 and 140 ms PCL (top). Compiled restitution curve of CaD80, in response to dynamic epicardial pacing (bottom left, n = 5–7 independent heart preparations). Longer CaD80 values observed at slower rates (200 vs. 140 ms PCL, n = 7 independent heart preparations). (C) Representative signals and CaD80 maps from a swine heart paced at 350 and 200 ms PCL (top). Compiled restitution curve of CaD80, in response to dynamic epicardial pacing (bottom left, n = 3–11 independent heart preparations). Longer CaD80 values observed at slower rates (350 vs. 200 ms PCL, n = 6–11 independent heart preparations). (D) Representative signals from hiPSC-CM paced at 3330 and 1430 ms PCL (top). Compiled restitution curve of CaD80, in response to field potential stimulation (bottom left, n = 4–5 independent cell preparations). Longer CaD80 values observed at slower rates (3330 vs. 1430 ms PCL, n = 4–5 independent cell preparations). Values reported as mean ± SD. *p < 0.05, as determined by an unpaired Student’s t-test (two-tailed).

