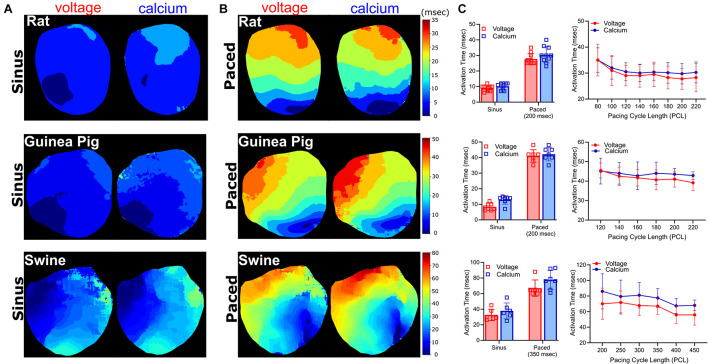
FIGURE 6.
Activation time measurements. Voltage and calcium activation maps generated from excised Langendorff-perfused hearts, during (A) sinus and (B) epicardial dynamic pacing applied to the left ventricle (rat: 200 ms, guinea pig: 200 ms, swine: 350 ms PCL). (C) Left: Average activation time delay during sinus rhythm, compared with dynamic epicardial pacing (n = 10 rat, n = 7 guinea pig, n = 6–8 swine independent heart preparations). Right: Activation time restitution curves for rat (n = 4–8), guinea pig (n = 6–7), and swine (n = 3–6 independent heart preparations).

