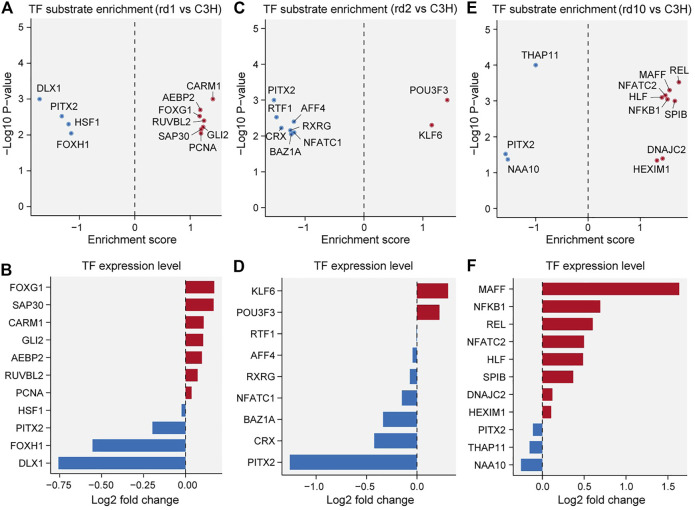
FIGURE 4.
Transcriptional factor (TF) substrate enrichment analysis in the three RD models versus C3H mice. (A, C, E) TF substrate enrichment score and significance in Pde6b rd1 (B), Prph rd2 (D), and Pde6b rd10 (F) mice; PITX2 were all down-regulated in RD mice compared with the C3H mice. (B, D, F) Log2 fold changes of the indicated TF expression levels in Pde6b rd1 (B), Prph rd2 (D), and Pde6b rd10 (F) mice. FOXG1, KLF6, and MAFF were up-regulated in RD mice; while DLX1 and NAA10 were down-regulated in RD mice.

