FIGURE 7.
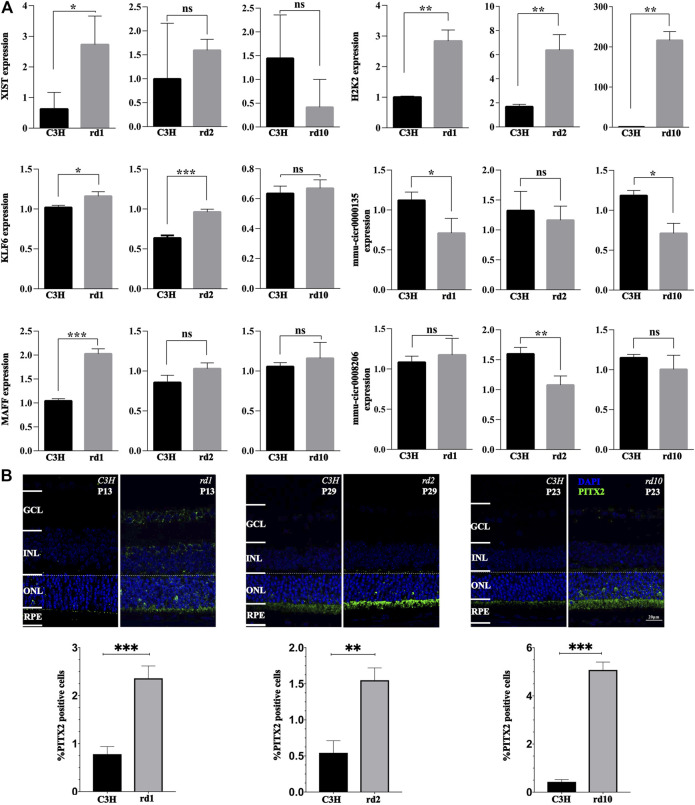
Validation of gene expression changes via qPCR and immunofluorescence. (A) The relative levels of XIST, H2K2, MAFF, KLF6, mmu-circ0000135, and mmu-circ0008206 in different groups at different times determined by real-time quantitative PCR. (B) PITX2 expression in C3H wild-type, rd1, rd2, and rd10 retina at time-points corresponding to the peak of retinal degeneration as assessed by immunofluorescence. Quantification in bar graphs displays the percentage of PITX2 positive cells in the outer nuclear layer (ONL). Significance levels indicated by asterisks: * = p < 0.05, ** = p < 0.01, *** = p < 0.001.

