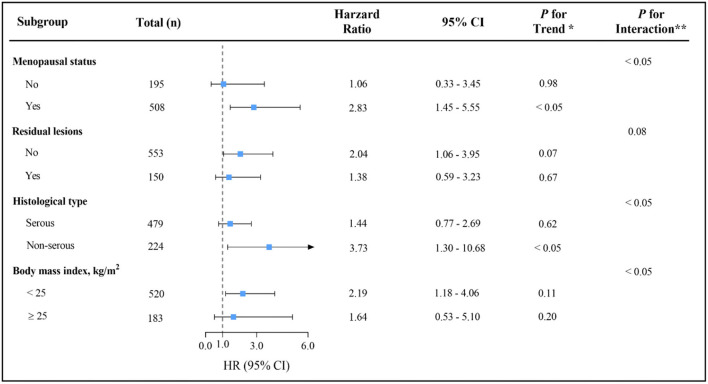
Figure 3.
Multivariable hazard ratios (HRs) and 95% CIs for overall survival among ovarian cancer patients across strata of various factors. The analyses used three categories of total dairy intake (T1 < 14.76, T2 14.76-90.00 and T3 ≥ 90.00g/d). The forest plot represents the HRs of the comparison of the highest versus the lowest of dairy intake. Cox model stratified by menopausal status, residual lesions, histological type and body mass index, with additional adjustments for age at diagnosis, comorbidities, diet change, dietary pattern, education, FIGO stage, histopathologic grade, parity, physical activity, smoke status and total energy.* indicates P for trend across levels of total dairy intake.** indicates P for interaction between strata and total dairy intake.

