Figure 6.

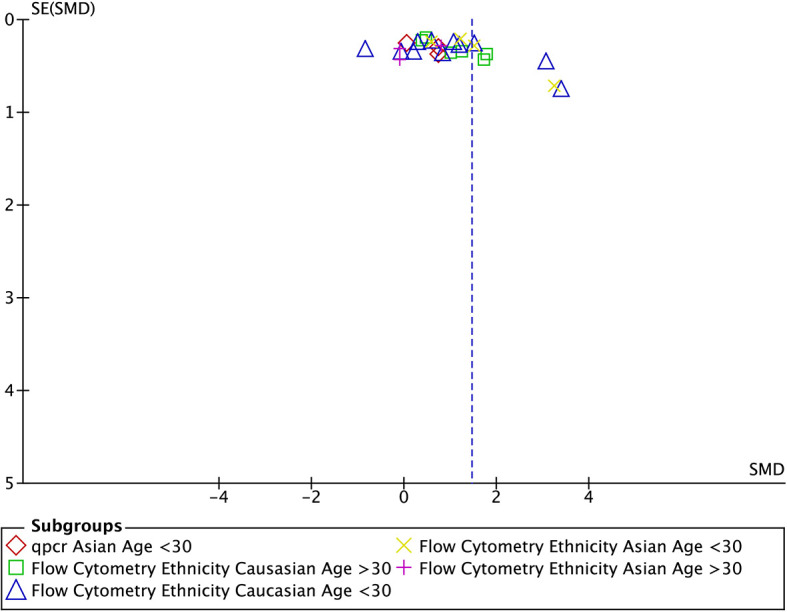
Funnel plot for studies looking at the number of Tregs in the maternal blood included in the subgroup meta-analysis (n=30). SE, standard error; SMD, standardised mean difference.

Funnel plot for studies looking at the number of Tregs in the maternal blood included in the subgroup meta-analysis (n=30). SE, standard error; SMD, standardised mean difference.