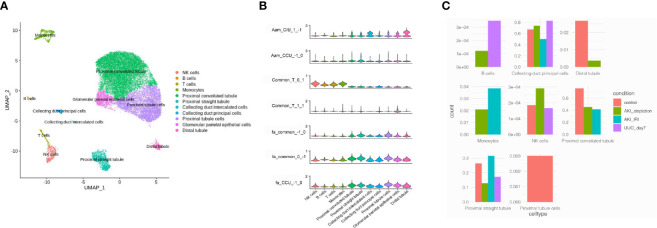
Figure 4.
Mapping common and specific genes in single cell data. (A) Cell type distribution of human kidney single-cell RNA-sequencing data. (B) Enrichment of different pathways in each cell type. Aam, arachidonic acid metabolism; Fa, fatty acid metabolic process; T, T cell activation. CIU (from healthy to IRI-induced AKI to fibrosis) or CCU (from healthy to cisplatin-induced AKI to fibrosis), genes in this pathway are specific to CIU or CCU, respectively; Common, genes in this pathway are shared in the same module of CIU/CCU. 1−1, −10, 01, 11, and 1−1, refer to the gene module. (C) Cell counts in different patterns.

