
FIGURE 4.
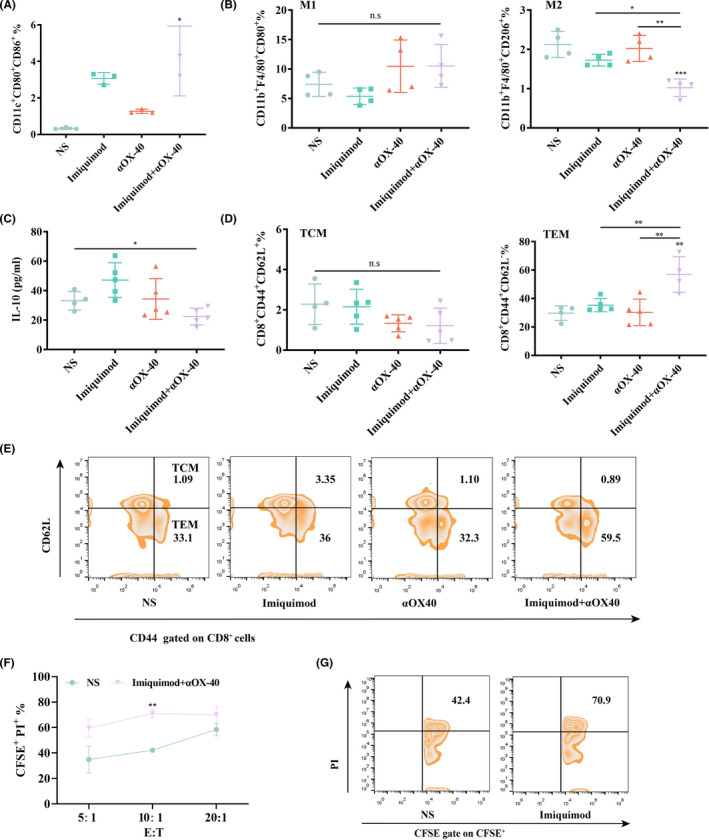
In situ vaccination activated tumor microenvironment. (A) Proportions of cDC1 in the tumor microenvironment analyzed by flow cytometry (gated on CD11c+CD80+CD86+ DCs) at day 15 (n = 3). (B) Proportions of M1‐like macrophages (gated on CD11b+F4/80+CD80+ macrophages) and M2‐like macrophages (gated on CD11b+F4/80+CD206+ macrophages) in the tumor microenvironment analyzed by flow cytometry at day 15 (n = 4). (C) Cytokine levels in tumors excised from mice at day 15 (n = 5). (D‐E) Proportions of central memory T cells (TCM) and effector memory T cells (TEM) in the spleen analyzed by flow cytometry (gated on CD3+CD8+T cells) at day 15 (n = 5). (F) Spleen cells of mice in imiquimod +αOX40 group were incubated with CFSE labeled H22 hepatocellular carcinoma cells at effector‐to‐target ratio (E: T) of 5:1, 10:1 and 20:1. PI was added 6 h after incubation and the percentage of dead cells was analyzed by flow cytometry (n = 3). (G) Proportions of dead cells of H22 tumor cells (CFSE+PI+/ CFSE+). P‐value:*, P < .05; **, P < .001; n.s, not significant