
FIGURE 5.
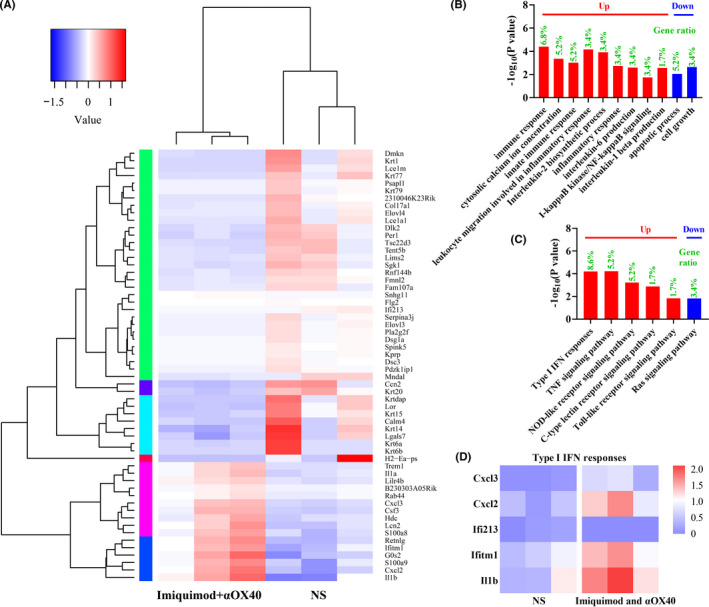
RNA‐seq analysis of tumors after in situ vaccination. (A) Cluster diagram of differential genes. The high‐expression genes and low‐expression genes were clustered by log10 (FKPM+1). The color from blue to red indicates that the gene expression from low to high. (B) Go enrichment analysis. (C) KEGG enrichment analysis. (D) Differential genes of type I IFN responses analyzed by RNA sequencing