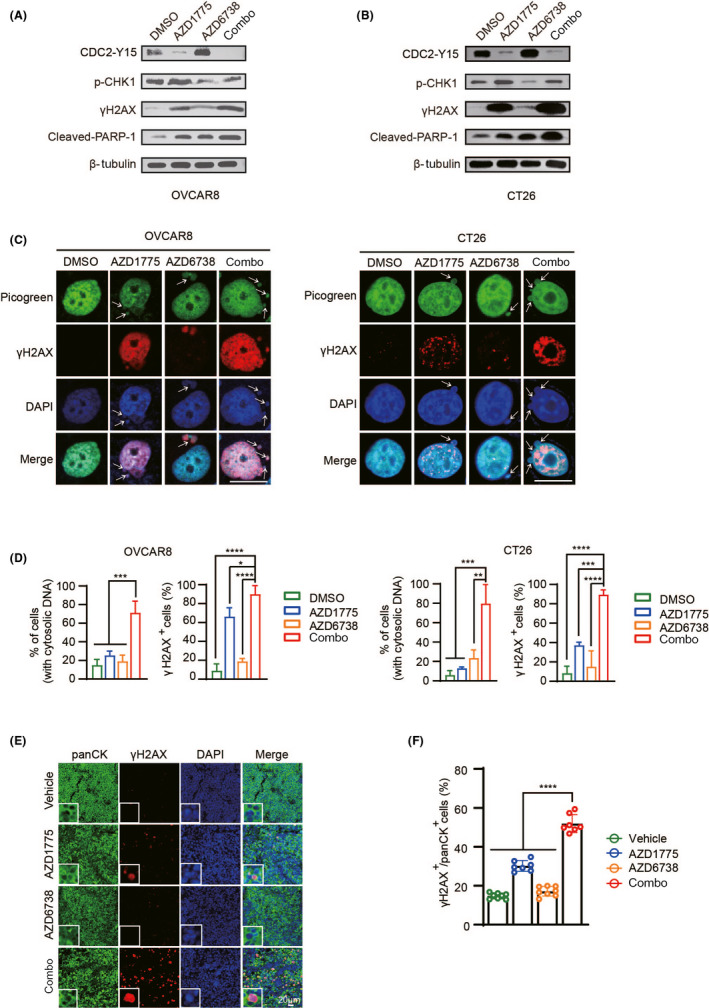
FIGURE 3.

The combination induces DNA damage and cytoplasmic dsDNA accumulation. A, B, OVCAR8 and CT26 cells were treated with DMSO, 300 nM AZD1775 or AZD6738 or combination for 72 h, and the indicator protein was detected by western blot. C, Representative images of PicoGreen and γH2AX staining in OVCAR8 and CT26 cells. The cytosolic dsDNA is indicated by the white arrows. Scale bar: 20 μm. D, Quantification and statistical analysis of (C). E, Representative image of co–localization of panCK (green) and γH2AX (red). F, Quantification of positive cells in (E). *P < .05, **P < .01, ***P < .001, ****P < .0001
