FIGURE 3.

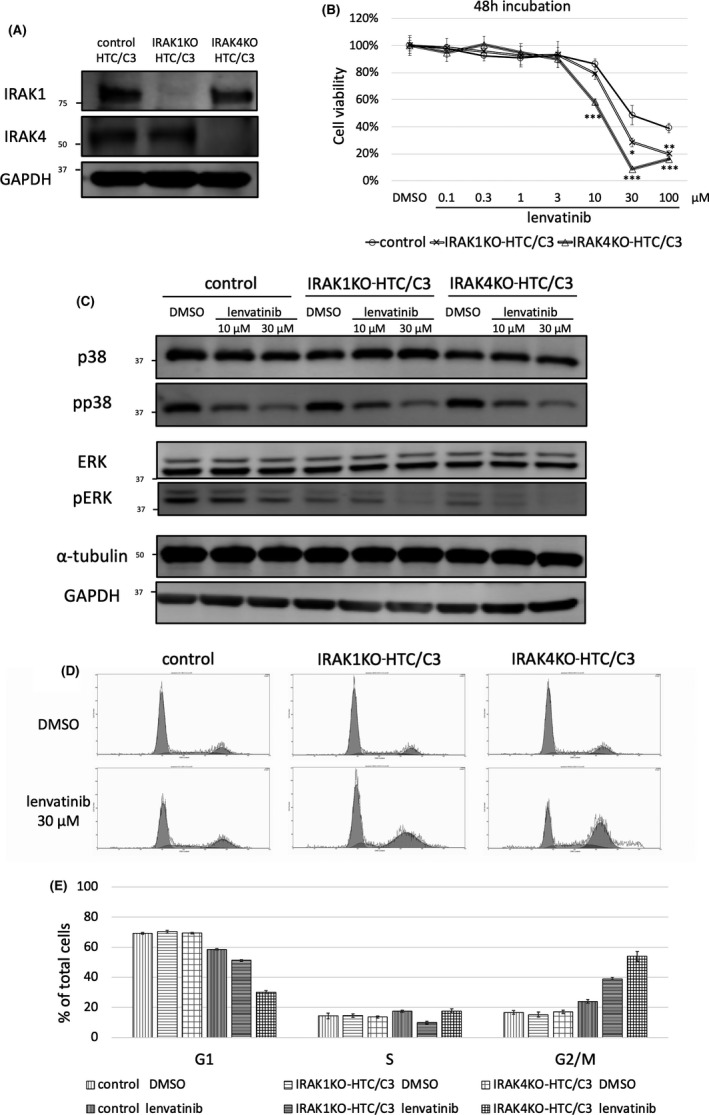
Knockout of IRAK1/4 enhanced the antiproliferative effect of lenvatinib in HTC/C3 cells. A, IRAK1 or IRAK4 was knocked out using IRAK1 or IRAK4 CRISPR/Cas9 knockout plasmid in HTC/C3 cells (IRAK1KO‐HTC/C3 or IRAK4KO‐HTC/C3). Deletion of IRAK1 and IRAK4 were validated by western blot analysis. B, Control plasmid‐treated HTC/C3, IRAK1KO‐HTC/C3, and IRAK4KO‐HTC/C3 cells were treated with lenvatinib for 48 h. Cell viability was calculated by cell viability assay. The vertical axis shows the cell viability. The horizontal axis shows the concentration of lenvatinib. The difference in viability between control and knockout cells at each concentration was evaluated using Dunnet test after 1‐way ANOVA. *P < .05; **P < .01; ***P < .001 compared with the control. Data are presented as mean ± SD. C, Effect of lenvatinib on phosphorylation status of p38 and ERK in IRAK1KO‐HTC/C3 and IRAK4KO‐HTC/C3 cells. Control plasmid‐treated HTC/C3, IRAK1KO‐HTC/C3, and IRAK4KO‐HTC/C3 cells were treated for 24 h with DMSO, 10 μM, or 30 μM lenvatinib. Protein expression levels of p38 and ERK were evaluated by western blot analysis. D, Effect of lenvatinib on cell cycle in IRAK1KO‐HTC/C3 and IRAK4KO‐HTC/C3 cells. DNA histogram was measured by cell cycle analysis. Control plasmid‐treated HTC/C3, IRAK1KO‐HTC/C3, and IRAK4KO‐HTC/C3 cells were treated with DMSO or 30 μM lenvatinib. Cell cycle analysis was performed after 48 h. E, The cell cycle fractions of the G1, S, and G2/M phases were calculated based on DNA histograms. Data are presented as mean ± SD
