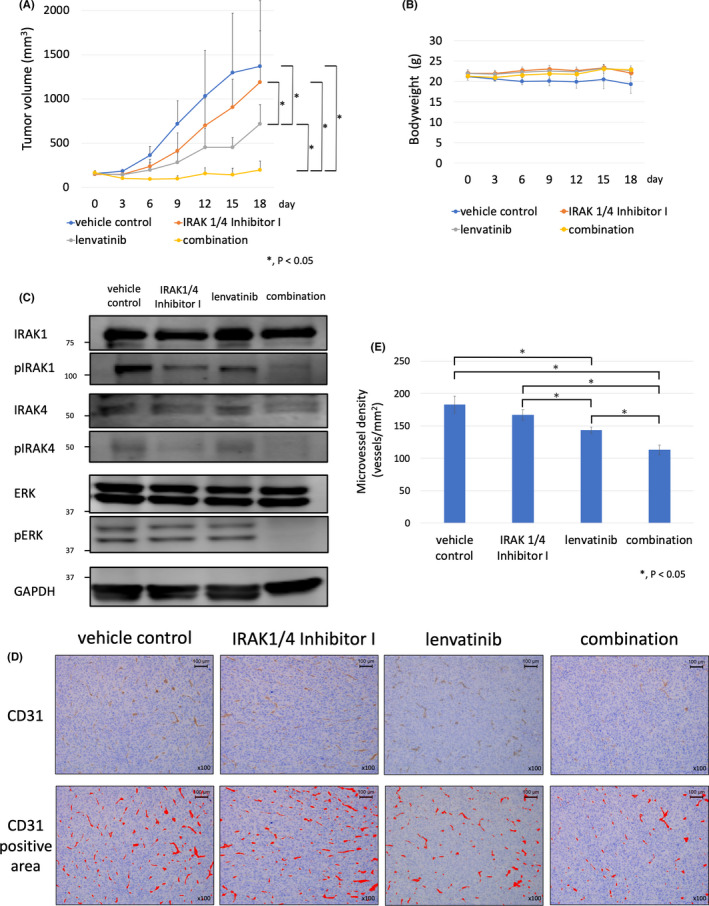
FIGURE 4.

IRAK1/4 Inhibitor I enhanced the antitumor effects of lenvatinib in HTC/C3 xenograft mouse model. A, HTC/C3 cells (1 × 10⁷) were inoculated into the flank region of 7‐wk‐old female nude mice (BALB/c‐nu) subcutaneously. After tumor formation, the mice were assigned to each group (vehicle control, IRAK1/4 Inhibitor I, lenvatinib, and combined IRAK1/4 Inhibitor I and lenvatinib). Lenvatinib was administrated orally at a dose of 10 mg/kg daily for 14 d and IRAK1/4 Inhibitor I was administrated intraperitoneally at a dose of 5 mg/kg daily for 14 d. Differences between groups were evaluated using the Steel‐Dwass test after 1‐way ANOVA. Data are presented as mean ± SD. B, Effect of the combined use of lenvatinib and IRAK1/4 Inhibitor I on body weight in the HTC/C3 xenograft mouse model. Time course of the body weights of the vehicle control, IRAK1/4 Inhibitor I, lenvatinib, and combination groups are shown. Data are presented as mean ±SD. C, Effect of the combined use of lenvatinib and IRAK1/4 Inhibitor I on phosphorylation status of IRAK1, IRAK4, and ERK in resected tumors from HTC/C3 xenograft mouse model. Tumors were resected after 14 d of treatment with vehicle control, IRAK1/4 Inhibitor I alone, lenvatinib alone, and combination groups. Protein expression levels of IRAK1, IRAK4, and ERK were evaluated by western blot analysis. D, Antiangiogenic effects of the combined use of lenvatinib and IRAK1/4 Inhibitor I in the HTC/C3 xenograft mouse model. Immunohistochemical staining of vascular endothelial cells of resected tumor tissue was performed using anti‐CD31 antibody (×100 magnification). High microvessel density (MVD) sites in the vehicle control, IRAK1/4 Inhibitor I, lenvatinib, and combination groups were imaged at ×100 magnification. CD31 positive areas are shown by a red color. E, The number of vessels per mm2 in high‐MVD sites was counted using ImageJ software and shown graphically. Differences between groups were evaluated using Steel‐Dwass test after 1‐way ANOVA. Data are presented as mean ± SD
