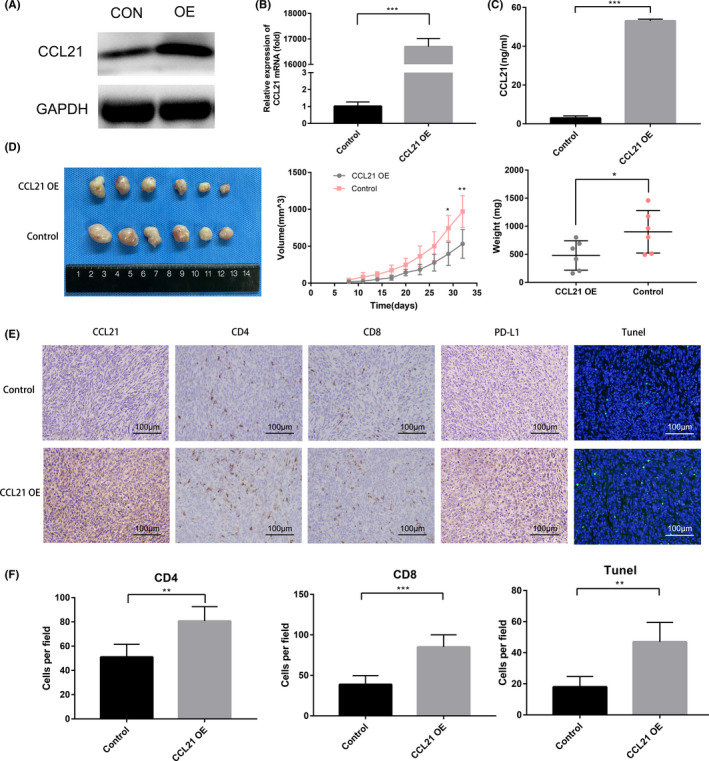
FIGURE 2.

Chemokine C‐C motif ligand 21 (CCL21) promoted T cell infiltration as well as increased programmed death‐ligand 1 (PD‐L1) expression in vivo. A‐C, (A) Western blot analysis, (B) quantitative real‐time PCR analysis, and (C) ELISA analysis for CCL21 in CCL21 overexpressing (OE) and relative control Panc02 (CON) cells. D, Images (left), volumes (middle), and weights (right) of the CCL21 OE vs control Panc02 tumors in C57BL/6 mice. E, Immunohistochemical images of CCL21 and PD‐L1 expression levels and tumor‐infiltrating lymphocyte densities, and immunofluorescent images of TUNEL staining in CCL21 OE vs control Panc02 tumors in C57BL/6 mice. Representative images are shown. Scale bars, 100 μm. F, Quantification of immunohistochemistry and immunofluorescence results of CD4+ T cells, CD8+ T cells, and TUNEL+ cells in CCL21 OE vs control Panc02 tumors in C57BL/6 mice. Each group contained six mice. Statistical significance was calculated by unpaired two‐tailed Student’s t tests. **P < .01, ***P < .001
