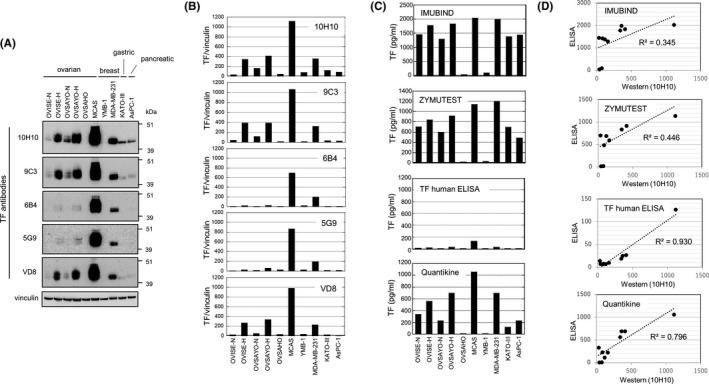
FIGURE 1.

Relationship between tissue factor (TF) levels detected by western blotting and those evaluated by ELISA. A, Western blot analysis of TF expression in various cancer cell lines with the same concentration (5 μg/mL) of primary Abs. Vinculin was used as the protein loading control. B, Densitometrical quantification of TF levels expressed in cancer cells by ImageJ software (https://imagej.nih.gov/ij/). Data were normalized to vinculin expression. C, ELISA TF expression in cancer cells. Data were calculated based on the TF standard included in each kit. Data reported are mean values of duplicate wells of a 96‐well plate. D, Linear regression analysis of the relationship between western blot and ELISA TF levels [Correction added on 7 October 2021, after first online publication: In Figure 1A caption, the value '(2 mg/mL)' was changed to '(5 μg/mL)'.]
