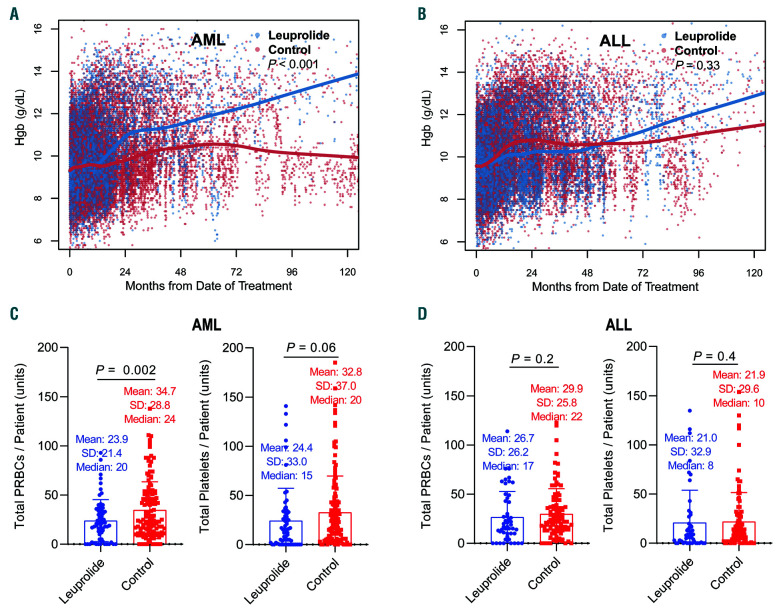
Figure 3.
Long-term changes in hemoglobin levels and transfusion requirements with and without leuprolide. (A-B) Scatterplots of all corresponding peripheral blood hemoglobin (Hgb) levels extracted from health records, collected between induction chemotherapy (day 0) and last follow-up date where each dot represents a single value (blue for leuprolide, red for control). (A) Acute myeloid leukemia (AML) matched cohorts and (B) acute lymphoblastic leukemia (ALL) matched cohorts. Lowess smooth curves were used for indicating longitudinal trajectories of counts and differences were assessed using the generalized estimation equation model. (C-D) Transfusion requirements: differences in the mean number of blood and platelet units given between induction chemotherapy date (day 0) and last follow-up date in AML (C) and ALL (D) comparing matched leuprolide and control cohorts. Each value represents the total number of transfusion units given during this time period for each patient.

