
Figure 3. Ucn3 negative beta cells are transcriptionally immature.
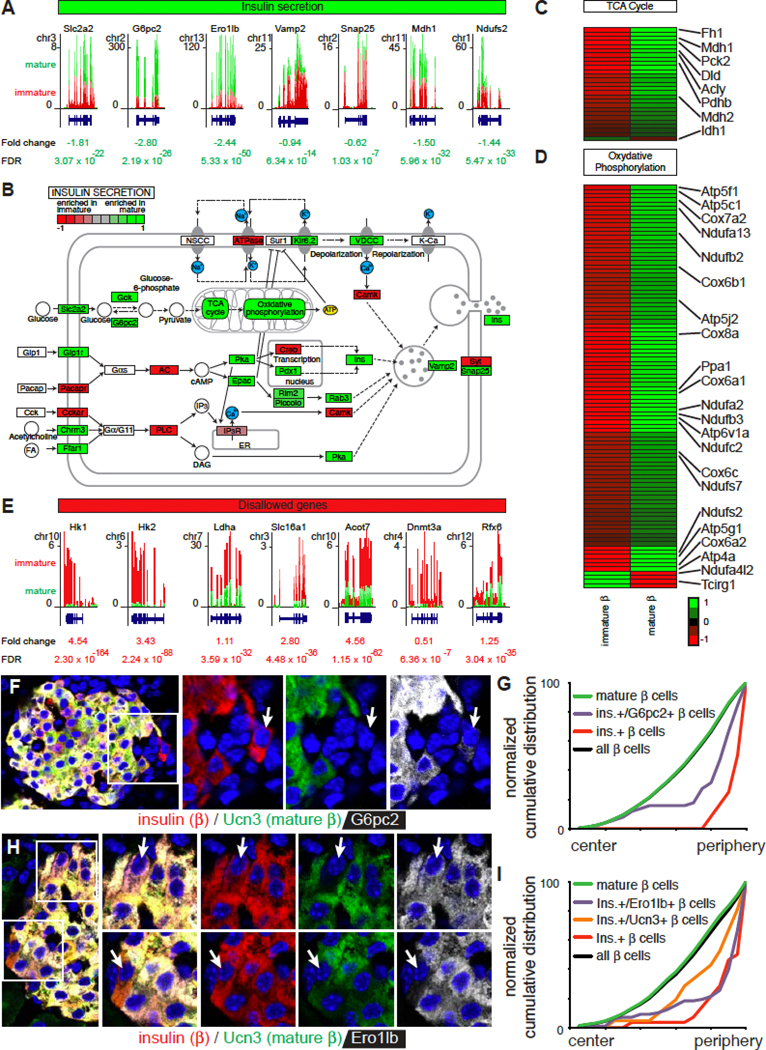
(A) Gene expression of select genes involved in insulin secretion in mature and immature beta cells by RNAseq.
(B) Visualization of differential expression of the Kegg pathway analysis for insulin secretion (FDR < 0.001).
(C) Heat map of the differential expression of tricarboxylic acid (TCA) cycle genes between immature and mature beta cells.
(D) Heat map of the differential expression of genes involved in oxidative phosphorylation between immature and mature beta cells.
(E) Gene expression of ‘disallowed’ genes in mature and immature beta cells by RNAseq.
(F) Immunofluorescence detection of G6pc2 (white), insulin (red) and Ucn3 (green) in a mouse islet. Arrow indicates an immature beta cell.
(G) Distribution of 2329 G6pc2-positive and negative beta cells within mouse islets (2329 cells). See Table S1B for the P values and D statistics for each pairwise comparison.
(H) Immunofluorescence detection of Ero1lb (white), insulin (red) and Ucn3 (green) in a mouse islet. Arrows indicate examples of beta cells with Ero1lb but not Ucn3 (top) and with Ucn3 but not Ero1lb (bottom).
(I) Distribution of 2043 Ero1lb-positive and negative beta cells within mouse islets (2073 cells).