Figure 2.
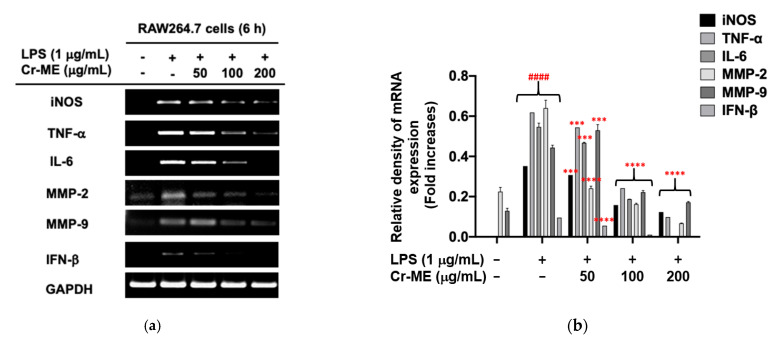
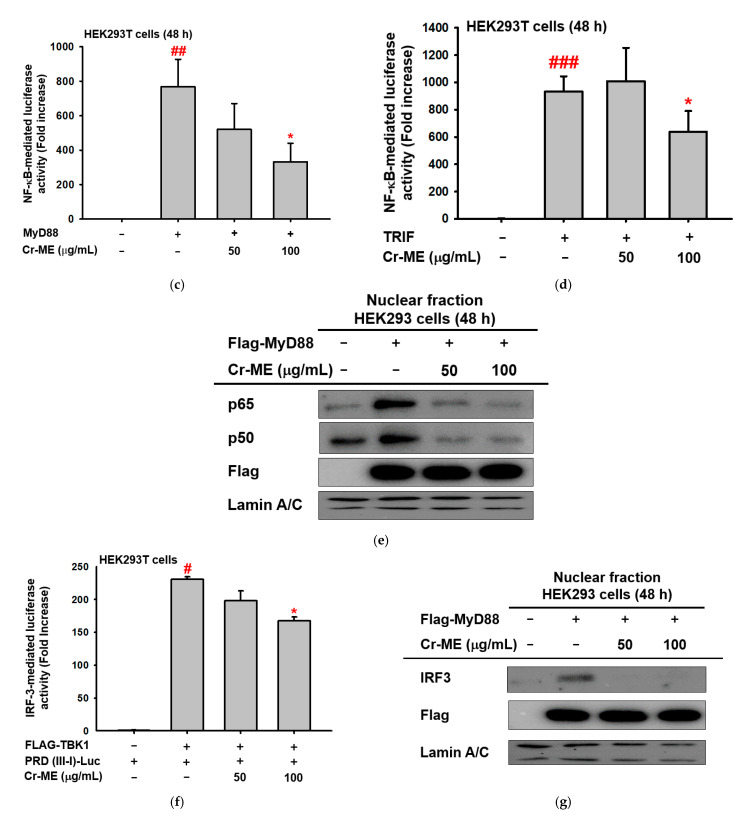
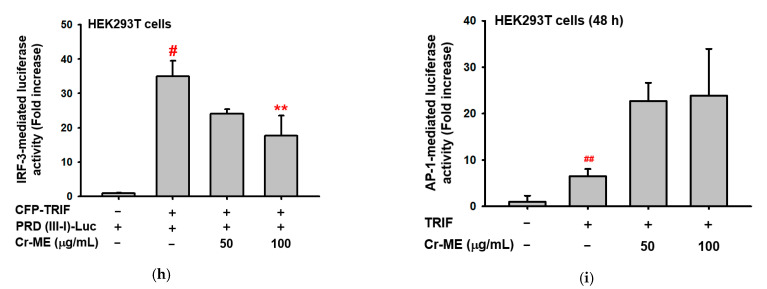
Suppressive effect of Cr-ME on the mRNA expression of inflammatory genes and their transcriptional activation. (a,b) The mRNA levels of inflammatory genes from RAW264.7 cells-stimulated with LPS (1 μg/mL) for 6 h in the presence or absence of Cr-ME (5 to 200 μg/mL) were measured by semi-quantitative RT-PCR (a) and relative band intensity of inflammatory genes was quantified using ImageJ software (b). (c,d,f,h,i) Effect of Cr-ME on transcription factor activation was determined by luciferase assay. HEK293T cells overexpressed with FLAG-MyD88 (c), CFP-TRIF (d,h,i) or FLAG-TBK1 (f) were transfected with plasmid constructs of NF-κB-Luc (c,d), PRD (III-I)-Luc (f,h), AP-1-Luc (i), and β-gal (as a transfection control) for 24 h, followed by treatment with Cr-ME (50–100 μg/mL) for additional 24 h. Luciferase activity was measured using a luminometer and normalized to that of β-gal. (e,g) Levels of p65, p50, Flag, IRF3, and lamin A/C in the nuclear fraction of HEK293T cells co-transfected with MyD88 (e) or TBK1 (g) were determined by Western blotting analysis. All the data (b–d,f,h,i) are expressed as the mean ± SD of three independent experiments. Relative band intensity (b) was measured using ImageJ. Statistical significance was calculated using one-way ANOVA (Dunnett’s t-test). # p < 0.05, ## p < 0.01, ### p < 0.001, and #### p < 0.0001 compared with the normal group, *** p <0.001 and **** p < 0.0001 compared to the LPS group, * p< 0.05 and ** p < 0.01 compared to control group.


