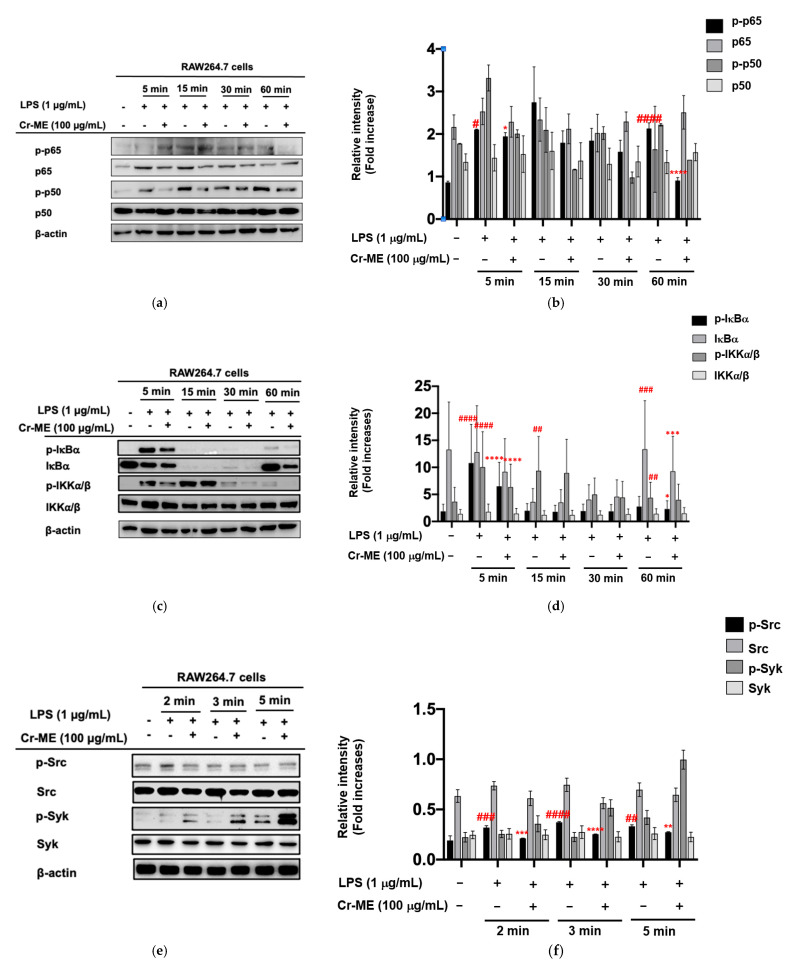
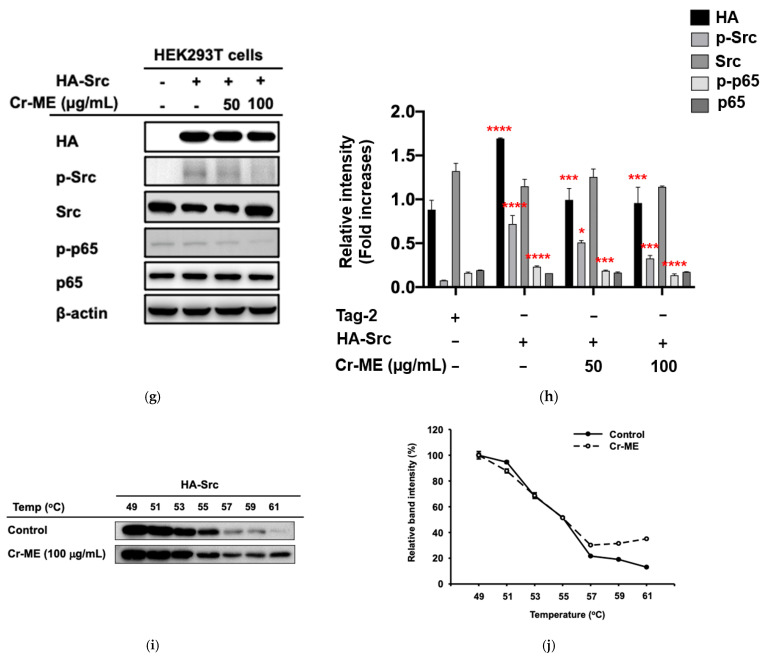
Figure 3.
Effect of Cr-ME on NF-κB pathway and its upstream enzyme Src activation. (a,b) The levels of phospho- forms of NF-κB subunits (p-p65 and p-p50) and their total proteins were determined by Western blotting analysis with whole cell lysates of RAW264.7 cells treated with LPS (1 μg/mL) in the presence or absence of Cs-ME (100 μg/mL) for the indicated times (a). Relative intensity of these proteins was calculated by ImageJ (b). (c,d). The levels of phospho-forms of IκBα and IKKα/β and their total proteins were determined by Western blotting analysis with whole cell lysates of RAW264.7 cells treated with LPS (1 μg/mL) in the presence or absence of Cs-ME (100 μg/mL) for the indicated times (c). Relative intensity of these proteins was calculated by ImageJ (d). (e,f) The levels of phospho-forms of Src and Syk and their total proteins were determined by Western blotting analysis with whole cell lysates of RAW264.7 cells treated with LPS (1 μg/mL) in the presence or absence of Cs-ME (100 μg/mL) for the indicated times (e). Relative intensity of these proteins was calculated by ImageJ (f). (g,h) The levels of phospho-forms of Src and p65 and their total proteins were determined by Western blotting analysis with whole cell lysates of HEK293T cells were transfected HA-Src in the presence or absence of Cs-ME (100 μg/mL) for 24 h (g). Relative intensity of these proteins was calculated by ImageJ (h). (i,j) The CETSA assay was conducted in the HA-Src-transfected HEK293T cells treated with Cr-ME (100 μg/mL) or DMSO (as a control) and then, Src level was determined by Western blotting analysis (i). Relative intensity of Src was calculated by ImageJ (j). All the data (b,d,f,h,j) expressed as the mean ± SD of three independent experiments. Statistical significance was calculated using one-way ANOVA (Dunnett’s t-test). # p < 0.05, ## p < 0.01, ### p < 0.001, and #### p < 0.0001 compared to normal group, and * p < 0.05, ** p < 0.01, *** p < 0.001, and **** p < 0.0001 compared to the control group.


