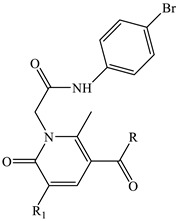
Table 1.
Effect of compounds 2, 4a–e, 6, 8a–e, 10, 11 on Ca2+ mobilization in FPR-transfected HL60 cells.

| Compound | R | R1 | FPR1-HL60 EC50 (µM) and Efficacy (%) a |
FPR2-HL60 EC50 (µM) and Efficacy (%) a |
hPMN EC50 (µM) and Efficacy (%) a |
|---|---|---|---|---|---|
| 2 | OH | CN | 3.5 ± 0.9 (100) | 9.2 ± 1.9 (100) | 4.3 ± 1.5 (120) |
| 4a | O-nC3H7 | CN | 16.3 ± 3.4 (115) | 3.2 ± 0.6 (140) | 6.4 ± 1.7 (115) |
| 4b | O-nC4H9 | CN | 29.7 ± 4.6 (70) | 18.3 ± 4.2 (75) | 27.9 ± 3.2 (110) |
| 4c | O-iC3H7 | CN | 7.7 ± 1.7 (180) | 8.4 ± 1.7 (85) | 10.2 ± 1.9 (120) |
| 4d | OCH2-3-OCH3-Ph | CN | 20.8 ± 3.7 (85) | 14.1 ± 3.8 (100) | 12.7 ± 3.9 (65) |
| 4e | OCH2CH2-3-OCH3-Ph | CN | 24.1 ± 5.2 (70) | 17.3 ± 4.1 (75) | 17.9 ± 4.2 (65) |
| 10 | 4-OCH3-Ph | CONH2 | 4.4 ± 0.5 (105) | 3.4 ± 0.7 (130) | 7.5 ± 2.1 (120) |
| 11 | 4-OCH3-Ph | CN | 5.2 ± 0.4 (105) | 1.9 ± 0.2 (110) | 7.8 ± 2.2 (120) |
| 6 | NH2 | CN | 27.1 ± 4.2 (60) | 8.4 ± 0.6 (125) | 29.1 ± 3.6 (90) |
| 8a | NHCH3 | CN | 2.2 ± 0.6 (105) | 1.3 ± 0.4 (115) | 4.9 ± 1.2 (105) |
| 8b | NHC2H5 | CN | 21.2 ± 1.2 (145) | 3.3 ± 0.2 (120) | 11.4 ± 3.1 (80) |
| 8c | nC3H7 | CN | 7.0 ± 0.7 (120) | 1.3 ± 0.1 (135) | 7.2 ± 1.6 (70) |
| 8d | nC4H9 | CN | 9.1 ± 1.4 (140) | 1.0 ± 0.4 (130) | 4.0 ± 0.9 (70) |
| 8e | N(CH3)2 | CN | 18.0 ± 3.5 (110) | 2.4 ± 1.2 (150) | 20.8 ± 4.8 (110) |
| fMLF | 0.01 | ||||
| WKYMVM | 0.001 | ||||
| AMC3 [24] | 1.6 ± 0.5 | 0.12 ± 0.02 | 0.39 ± 0.17 | ||
| AMC4 [24] | 3.0 ± 0.4 | 0.38 ± 0.09 | 0.83 ± 0.24 |
a EC50 values represent the mean of three independent experiments and were determined by nonlinear regression analysis of the concentration-response curves (5–6 points) generated using GraphPad Prism 9 with 95% confidential interval (p < 0.05).
