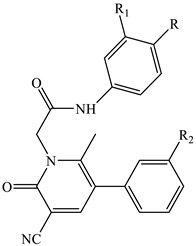
Table 2.
Effect of compounds 13a–c and 14a–c on Ca2+ mobilization in FPR-transfected HL60 cells.

| Compound | R | R1 | R2 | FPR1-HL60 EC50 (μM) and efficacy (%) a |
FPR2-HL60 EC50 (μM) and efficacy (%) a |
hPMN EC50 (μM) and efficacy (%) a |
|---|---|---|---|---|---|---|
| 13b | H | OH | OCH3 | N.A. b | N.A. b | N.A. b |
| 13c | OH | H | OCH3 | N.A. b | N.A. b | N.A. b |
| 14a | Br | H | OH | 0.23 ± 0.06 (115) | 0.23 ± 0.02 (150) | 3.7 ± 0.7 (130) |
| 14b | H | OH | OH | 40.1 ± 7.2 (50) | 37.6 ± 5.6 (150) | N.A. b |
| 14c | OH | H | OH | N.A. b | N.A. b | N.A. b |
| fMLF | 0.01 | |||||
| WKYMVM | 0.001 | |||||
| AMC3 [24] | 1.6 ± 0.01 | 0.12 ± 0.02 | 0.39 ± 0.17 | |||
| AMC4 [24] | 3.0 ± 0.4 | 0.38 ± 0.09 | 0.83 ± 0.24 | |||
a EC50 values represent the mean of three independent experiments and were determined by nonlinear regression analysis of the concentration-response curves (5–6 points) generated using GraphPad Prism 9 with 95% confidential interval (p < 0.05). b N.A. no activity (no response was observed during first the 2 min after addition of the compounds under investigation) considering the limits of efficacy < 20% and EC50 < 50 µM.
