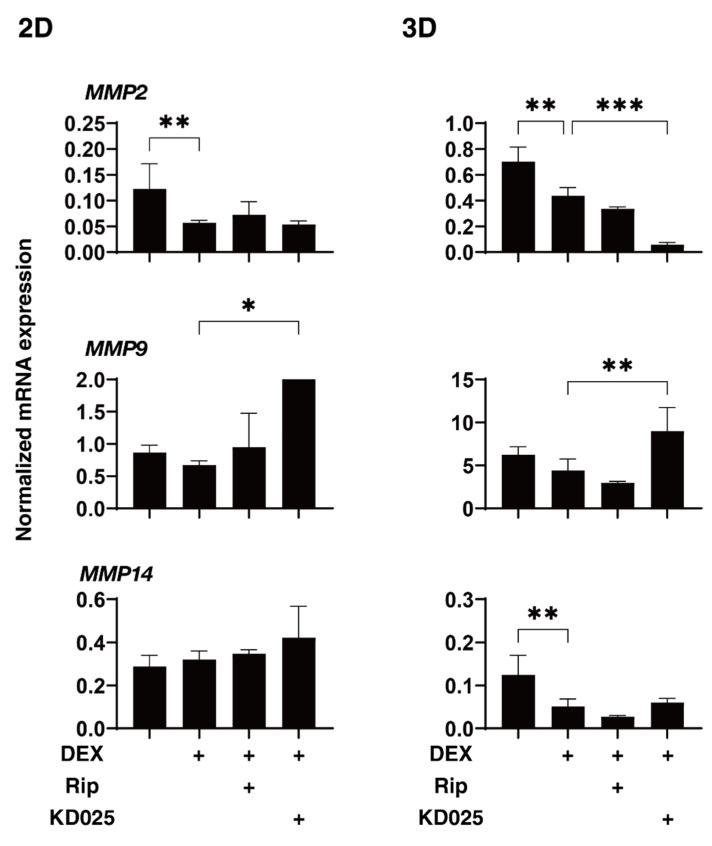
Figure 6.
mRNA expression of MMPs in 2D- and 3D-cultured HTM cells. On Day 6, HTM 2D cells and 3D spheroids (non-treated control; NT) and those treated with 250 nM in the absence or presence of 10 µM ripasudil (Rip) or KD025 were subjected to qPCR analysis to estimate the expression of mRNA of MMP2, 9 and 14. All experiments were performed in duplicate using 3 different confluent 6-well dishes (2D) or 15–20 freshly prepared 3D HTM spheroids (3D) in each experimental condition. Data are presented as the arithmetic mean ± standard error of the mean (SEM). * p < 0.05, ** p < 0.01, *** p < 0.005 (ANOVA followed by a Tukey’s multiple comparison test).

