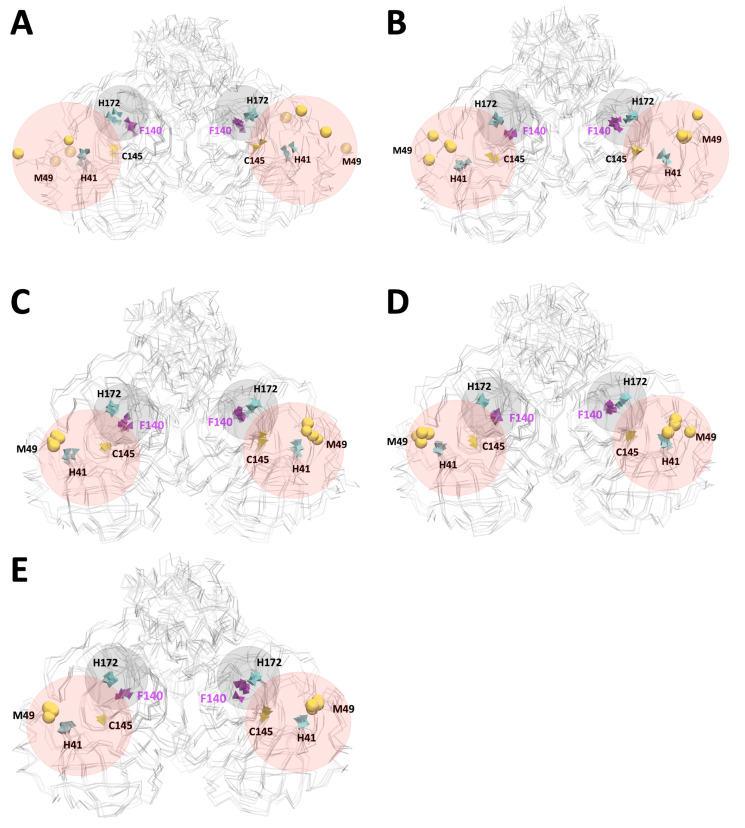
Figure 6.
Snapshots of the last frame of all microstates in Mpro, highlighting the active site (pink area) and pocket S1 (gray area). (A,B) pH 3 and pH 4 did not show a constant Met49–Cys145 distance, which was also analysed in the RMSF, where the Met49 residue showed high fluctuations at these pHs. (C–E) pH 5, pH 6 and pH 7 with a constant distance between Met49-Cys145, His41-Cys145 and His172-Phe140. The His41, His172, Cys145 and Phe49 residues (polyhedral graphic representation) and Met49 (bead graphic representation) are shown.

