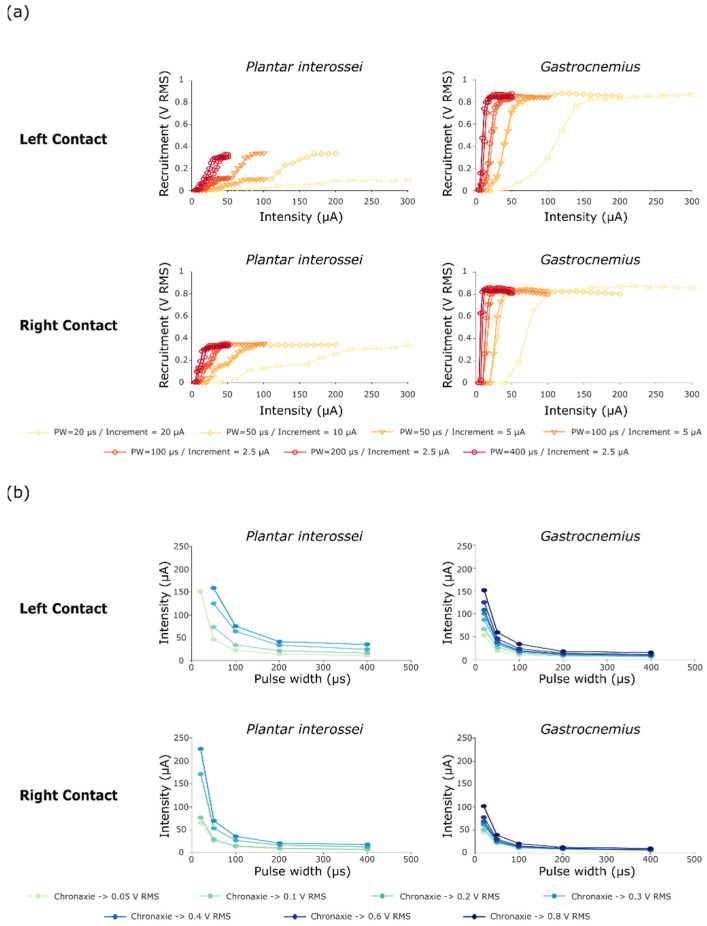
Figure 4.
Recruitment and chronaxie curves obtained after performing protocol 1. (a) Recruitment curves of Plantar interossei and Gastrocnemius muscles after stimulating with either a contact on the left or on the right side of the TIME#1 implant. Muscle activity is displayed as the RMS of the compound muscle action potential. (b) Chronaxie-rheobase-like curves plotted as a result of these stimulations, presenting the relative recruitment of both Plantar Interossei and Gastrocnemius muscles.

