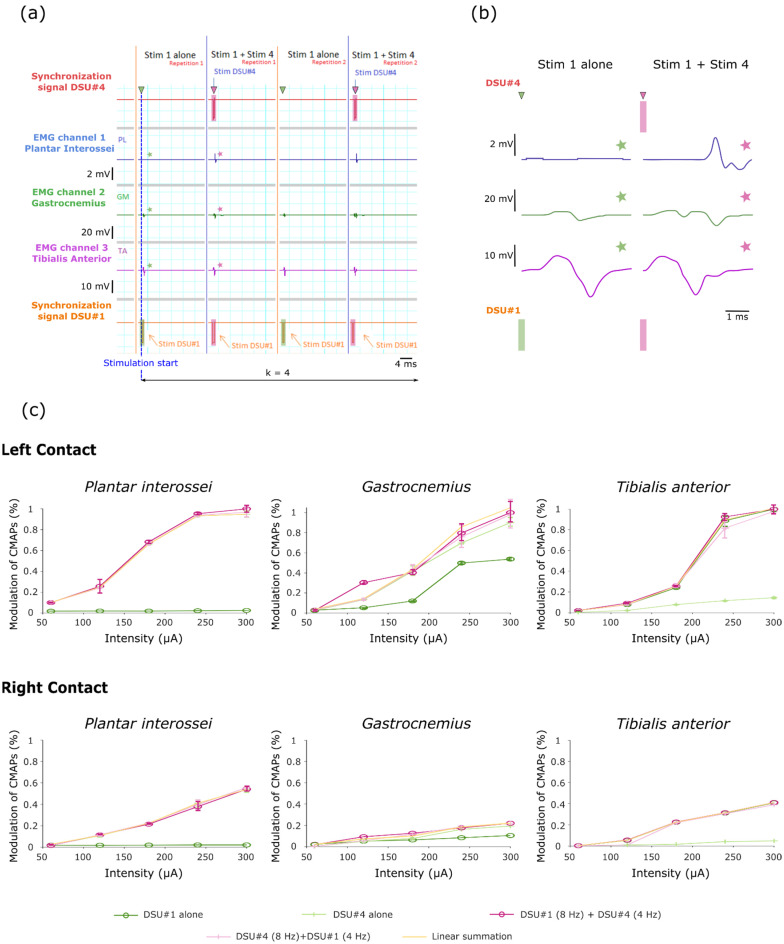
Figure 5.
Raw signals recorded during implementation of the second stimulation protocol and corresponding recruitment curves. (a) Example of raw data obtained when stimulating with left contacts for a 300 µA intensity (i.e., DSU #1 = 4 Hz, DSU #4 = 8 Hz, I = 1, j = 2 and k = 4—configuration based on Supplementary Figure S1). (b) Close-up on the three muscles CMAPs obtained after stimulating with either a single (DSU #1) or two DSUs (DSU #1 and DSU #4)—These signals correspond to those marked with a star in (a). (c) Recruitment curves obtained for each muscle following the implementation of the stimulation protocol. Note that the “cumulated RMS T#2T#3” curve corresponds to the calculation of the RMS theoretical value obtained by linear summation of the individual responses. Similarly, the presence of two curves corresponding to the stimulation with two DSU is linked to the protocol repetition after the reversal of the stimulation frequencies on both DSUs.

