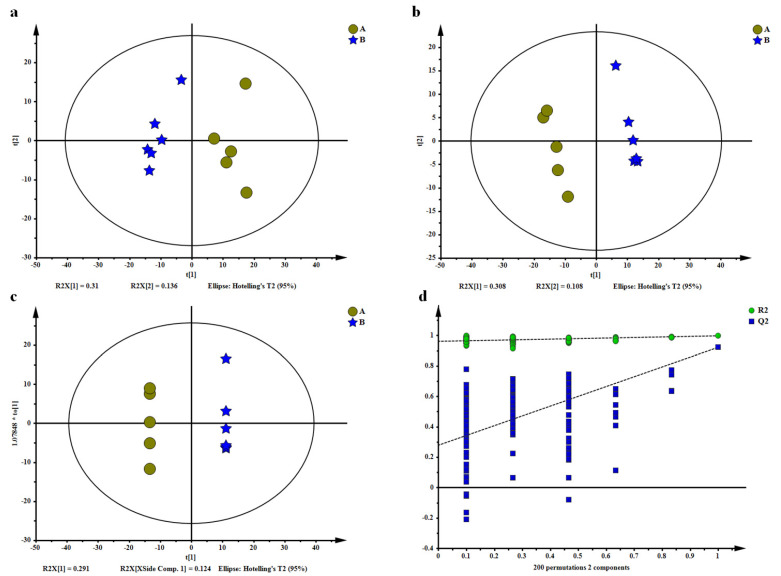
Figure 2.
(a) Score plots from principal component analysis. (b) Partial least squares discrimination analysis. (c) Orthogonal partial least squares discrimination analysis. (d) Its permutations test. The dataset comprised 966 filtered ion features. Stars in blue show samples from the HR treatment group, spots in yellow indicate the samples from the HA treatment group, Stars in blue show samples from the HR treatment group, spots in yellow indicate samples from the HA treatment group.

