Table 1.
Opacity values and real images of the appearance of the SP films to the human eye of polymeric bionanocomposite films.
| Sample | Opacity (AU × nm) |
Pictures | Sample | Opacity (AU × nm) |
Pictures |
|---|---|---|---|---|---|
| SP | 12.51 ± 0.02 a (at 400 nm) * |
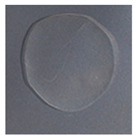
|
|||
| SP0.5MMT | 12.96 ± 0.09 a (at 510 nm) * |
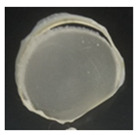
|
SP0.5MMT-s | 12.55 ± 0.09 a (at 510 nm) * |
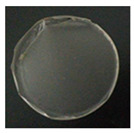
|
| SP1.0MMT | 23.28 ± 0.12 b (at 590 nm) * |
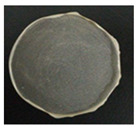
|
SP1.0MMT-s | 15.26 ± 0.08 c (at 590 nm) * |
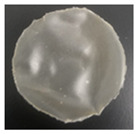
|
| SP1.5MMT | 28.87 ± 0.17 b (at 590 nm) * |
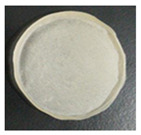
|
SP1.5MMT-s | 17.12 ± 0.11 c (at 590 nm) * |
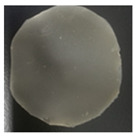
|
* Maximum absorption peak measured. SP control sample without nanoclay. Different letters (a, b, c) in the same column denote significant differences for the set of means in each treatment (with and without ultrasound) (p < 0.05).
