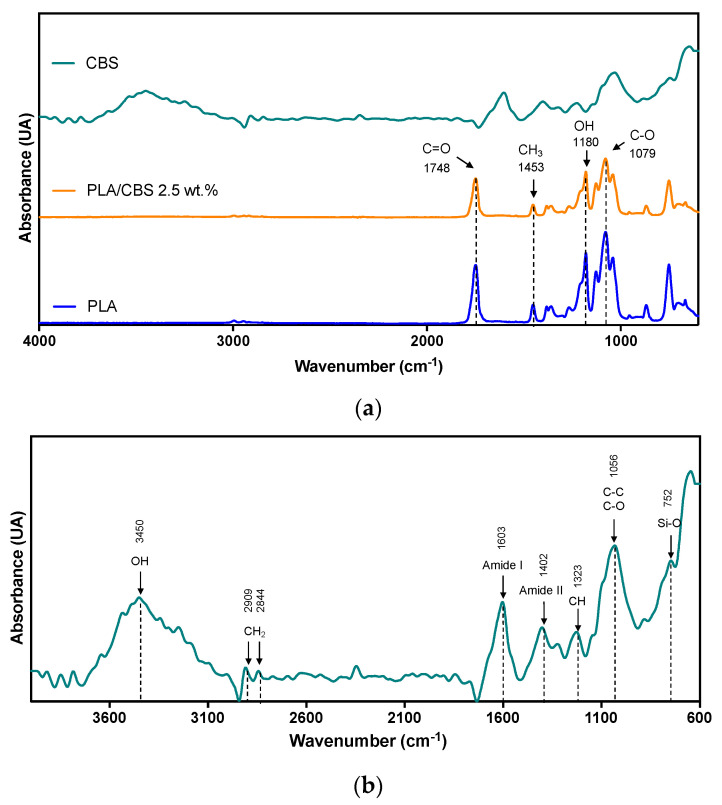
Figure 2.
(a) FTIR spectra of CBS fiber, neat PLA, and PLA/CBS 2.5 wt.% measured in frequency a range between 4000 and 600 cm−1. Arrows highlight representative peaks for amorphous PLA in 1748, 1453, 1180, and 1079 cm−1 present in all samples. (b) Magnification of CBS FTIR spectra from 4000 to 600 cm−1, with arrows at peaks attributed to main constituents of the fiber (cellulose, hemicellulose, and lignin).

