
Figure 3.
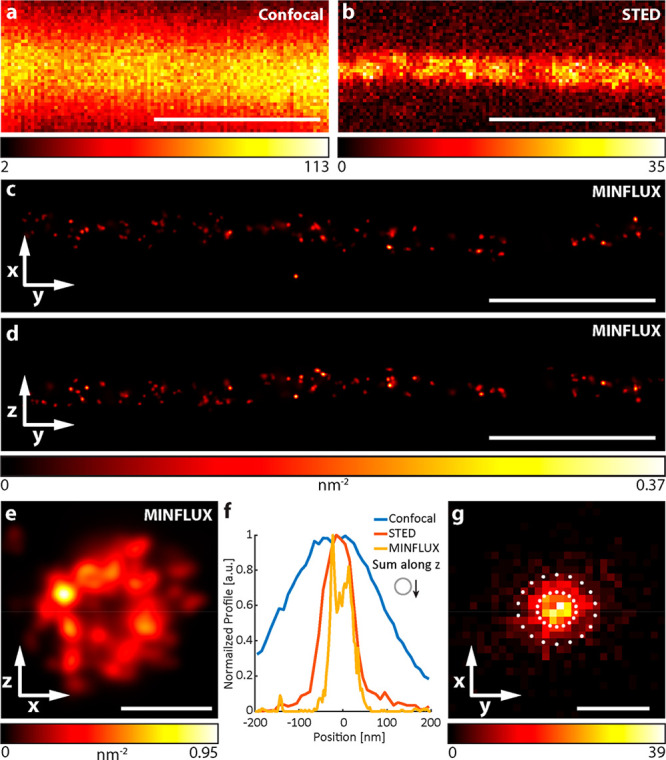
Confocal, STED, and MINFLUX images of microtubules from fixed immunolabeled U2OS cells. (a) Confocal and (b) 2D STED images of a single microtubule (α-tubulin labeled with primary antibody and secondary antibody with Abberior Star RED). (c, d) Rendered 3D MINFLUX side projections and (e) projection along the estimated tubule path, showing individual uncaged fluorophores with at least four localizations (α-tubulin labeled with primary antibody and secondary antibody with HCage 620). (f) Cross-section histogram along the x-axis for the different imaging methods (MINFLUX including emitters with less localizations). (g) Histogram of the localization spread around their emitter centers, considering emitters with at least four localizations (with 2000 photons each) and Gaussian-fitted localization precision with 1σ and 2σ indicated by circles (σx: 2.4 nm, σy: 2.7 nm). Scale bars: 500 nm (a–d), 50 nm (e), and 10 nm (g).