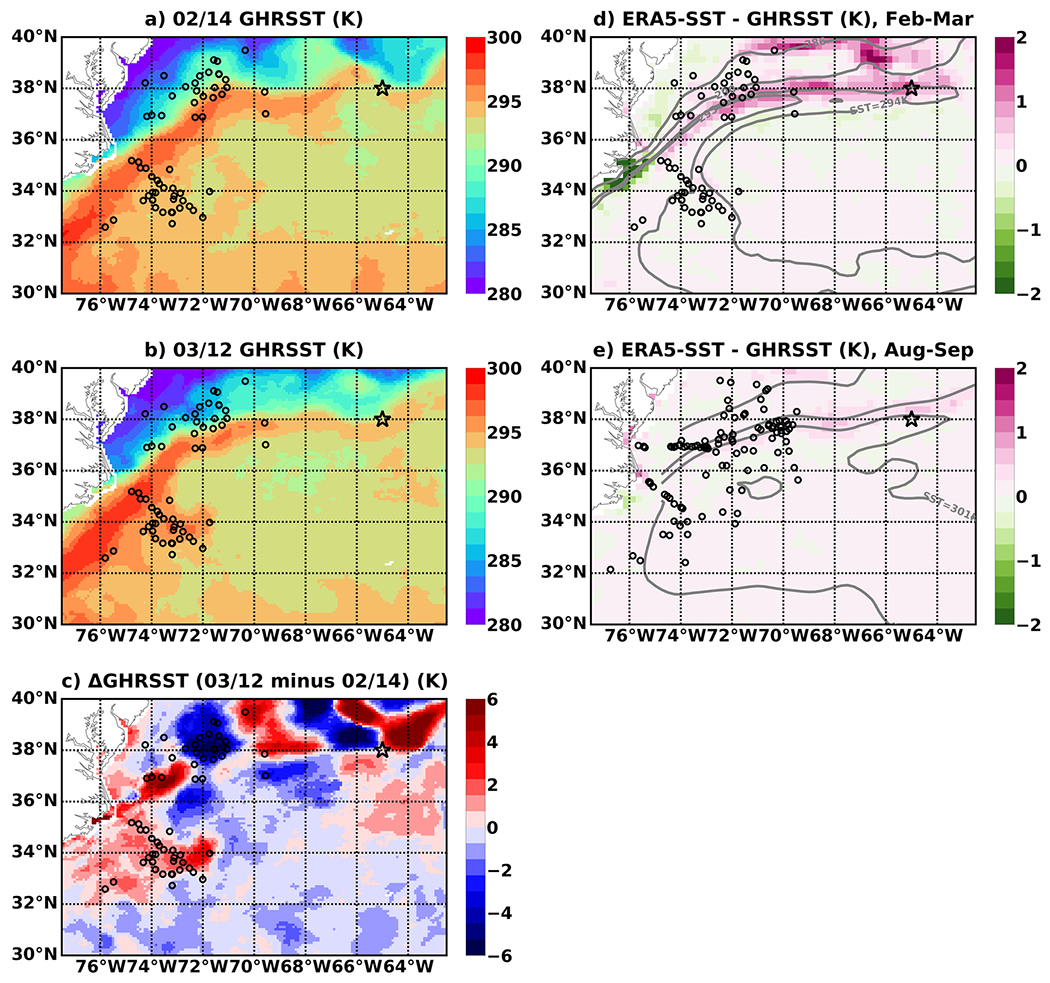
Figure 1.

Sea surface temperatures (GHRSST) on (a) February 14, 2020, (b) March 12, 2020, and (c) March 12–February 14, 2020. Open circles indicate ACTIVATE dropsonde locations, and the star denotes the CLIMODE buoy location. (ERA5-SST–GHRSST) differences for (d) February–March 2020 and (e) August–September 2020. Gray contours in (d) and (e) correspond to ERA5 SSTs of 286, 290, 294, and 295K in panel (d) and 301K in panel (e).
