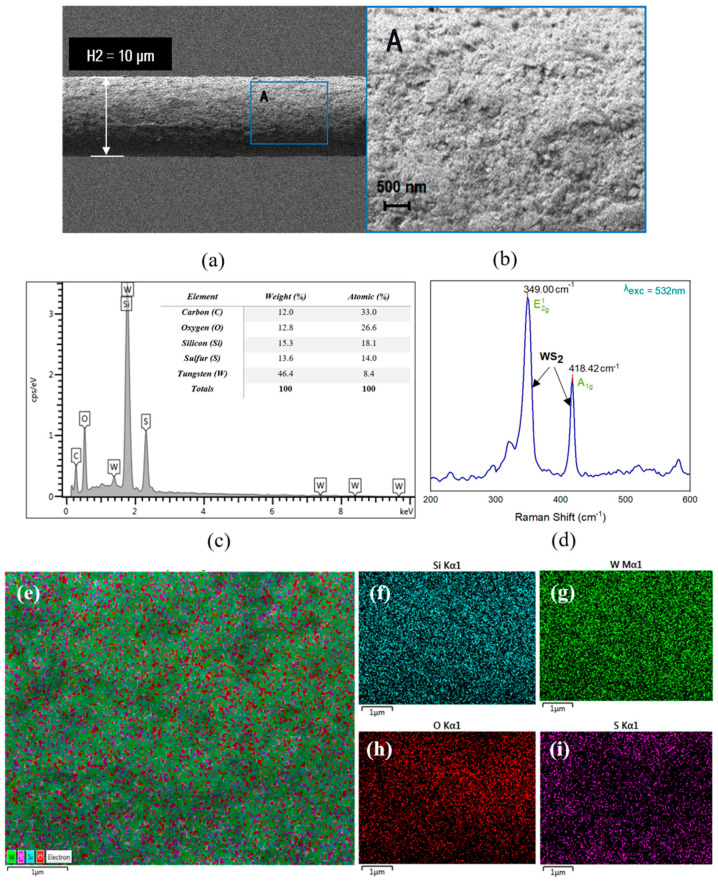
Figure 7.
FESEM image of the MF coated with WS2 (a). An enlarged view of the region marked by a blue rectangle is MF coated with WS2 at 10,000× magnification (b). EDX elemental spectrum and quantification results for tapered MF coated with WS2 (c). Raman spectra of WS2 coated on MF by drop-casting (d). EDX-elemental mapping on the tapered region of MF coated with WS2 (e). Silicon, (f) tungsten (W) (g); oxygen (O) (h), and sulfur (i) distribution mapping.

