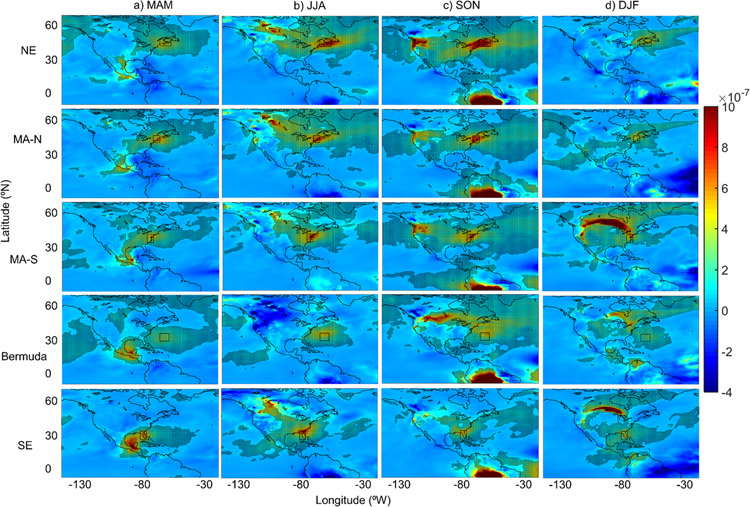
Figure 4.
Spatial maps of black carbon column density anomaly (kg m−2) for each respective sub-domain for (a) March–May (MAM), (b) June–August (JJA), (c) September–November (SON), and (d) December–February (DJF), computed as the difference between the mean MERRA-2 BC value on BB days and the mean value of all days in each respective set of months. Hashed areas denote grids where the anomaly value is statistically significant with 95% confidence based on the Student’s t-test. The black box denotes the sub-domain that the analysis was conducted for in each composite map.

