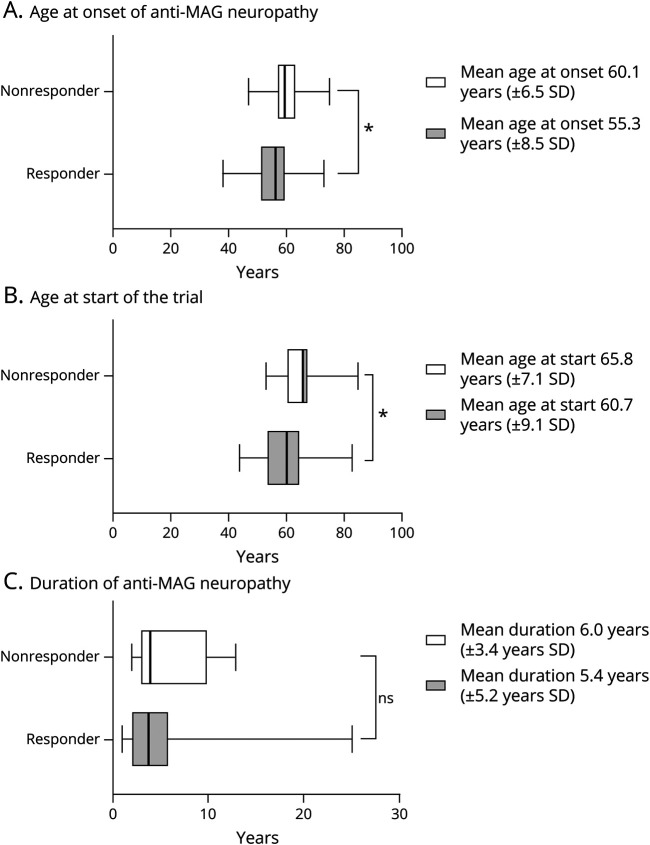
Figure 4. Analysis of the Clinical Study Patient Population.
(A) Mean age at onset of the neuropathy and (B) the mean age at the start of the clinical study was significantly lower in the responder group (n = 208 participants) compared with the nonresponder group (n = 191 participants); (C) The difference in disease duration until the patients participated in the clinical study was not significant. Data are shown as median and 95% confidence intervals, an independent t-test and Tukey Kramer test were performed (p < 0.05).

