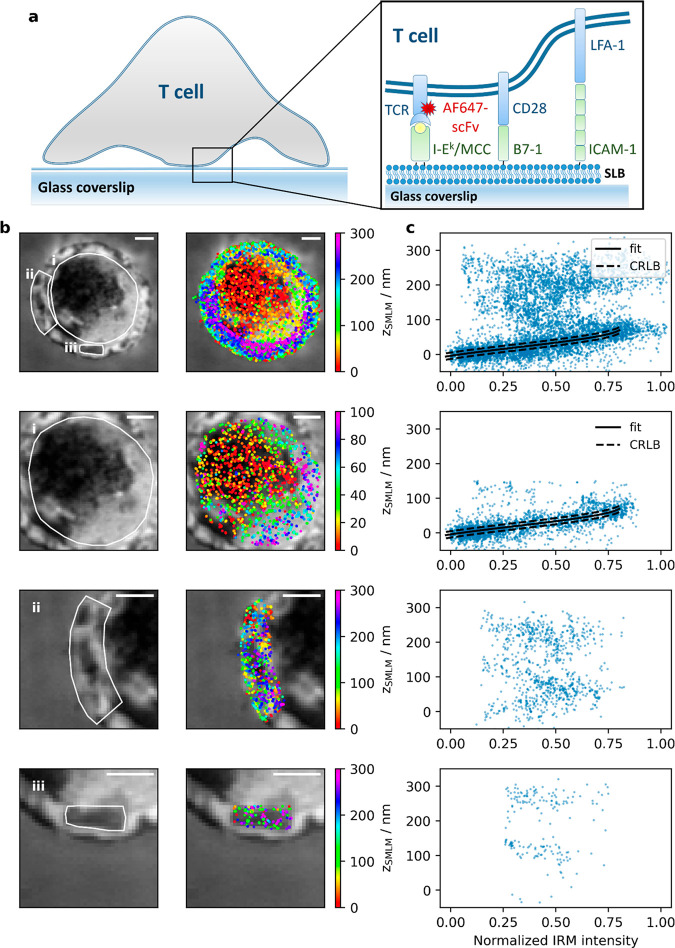
Figure 2.
Correlative 3D-SMLM and IRM within the immunological synapse. (a) Experiments were performed on a T-cell adhering to an SLB functionalized with I-Ek/MCC, B7-1 and ICAM-1; the TCR was labeled via AF647-conjugated H57-scFv. (b) IRM (left) and SMLM/IRM overlay images (right) of the immunological synapse. The areas i, ii, and iii are shown in magnification below. (c) Correlation plots between zSMLM and the normalized IRM intensity for the areas indicated in panel b. Data points with zSMLM < 100 nm were fitted with SI Materials and Methods eq 3 (solid line). The dashed lines indicate the square root of the Cramér-Rao lower bound. Scale bars 2 μm.

