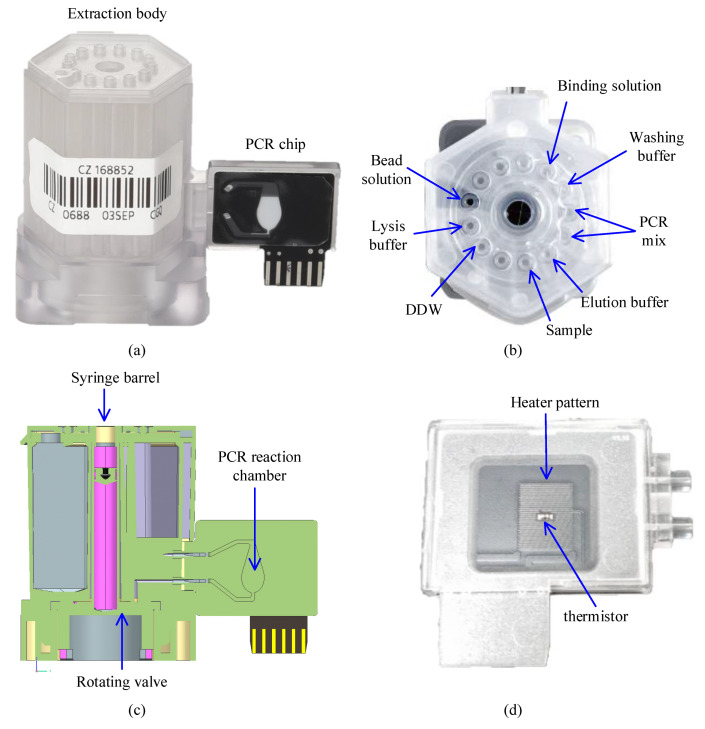
Figure 1.
The actual cartridge used to demonstrate the performance of control with the proposed software. (a) Side view of the cartridge; (b) Top view of the extraction body showing an example of reagents allocation into each chamber; (c) Cross section illustration of the cartridge; (d) The back-side picture of the PCR chip which shows the heater pattern and thermistor attached to the PCB.

