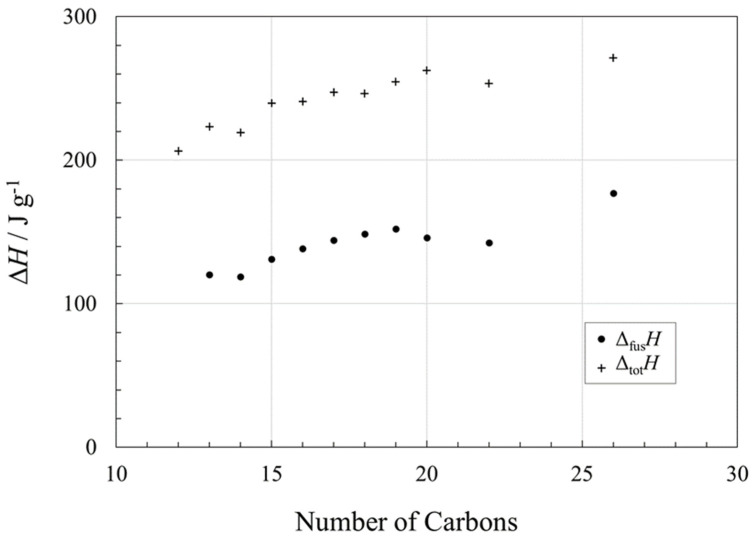
Figure 6.
Enthalpy changes (ΔH in J g−1) associated with phase transitions in linear 1-alcohols, as a function of chain length, n. Circles (●) represent the enthalpies of fusion, ΔfusH, and crosses (+) represent the total enthalpy changes of fusion plus that from solid–solid transition(s), if present, ΔtotH. See Supplementary Information for data and data sources.

