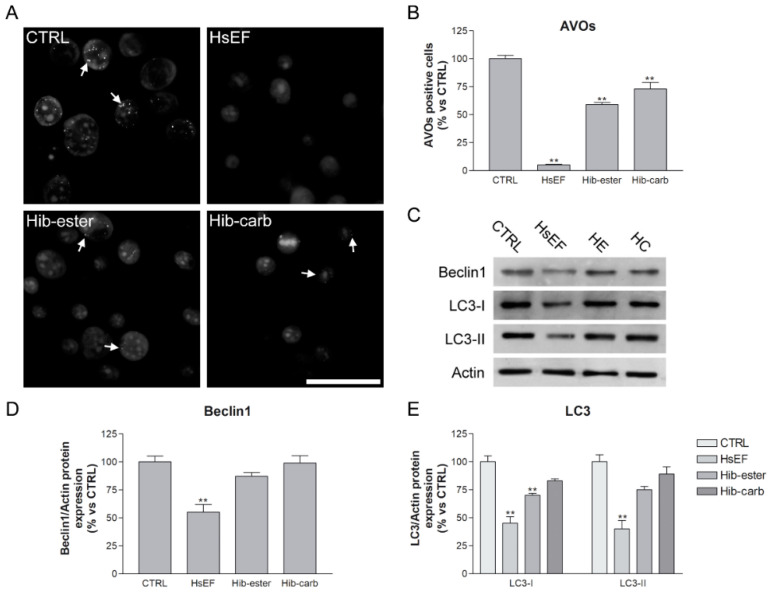
Figure 6.
Autophagy inhibition (A) representative images of RPMI 8226 cells stained with Acridine Orange. Cells were not treated (CTRL) or treated with HsEF 3 mg/mL, Hib-ester 450 µg/mL and Hib-carbaldehyde 200 µg/mL for 24 h. (B) Red fluorescence of Acridine Orange images was quantified and data were represented in the graph as the percentage of AVOs positive cells compared to untreated controls (arbitrarily set to 100%). (C) Representative images of Western blots of Beclin1, LC3-I, LC3-II and actin. RPMI cells were not treated (CTRL) or treated with HsEF 3 mg/mL, Hib-ester 450 µg/mL and Hib-carbaldehyde 200 µg/mL for 24 h. (D,E) Quantification of Western blots of Beclin1, LC3-I and LC3-II. Data are expressed as mean percentage ± SD compared to untreated controls, arbitrarily set to 100%. (** p < 0.01 vs. CTRL).

