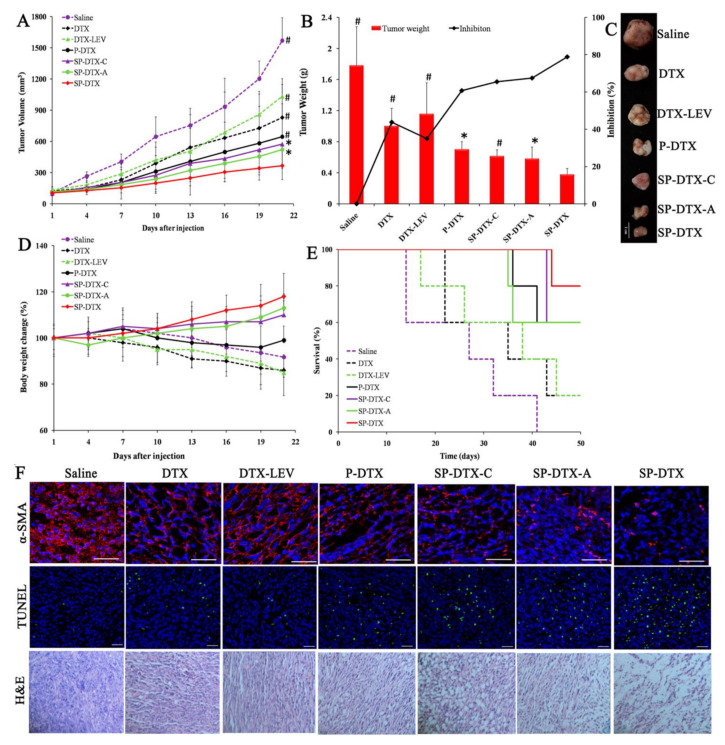
Figure 2.
In vivo anticancer efficacy of various DTX formulations. (A) Tumor growth curves after intravenous injection of either saline, DTX, DTXLEV, P-DTX, SP-DTX-C, SP-DTX-A, or SP-DTX on mice bearing stroma-rich prostate xenograft tumors every 5 days for four times (5 mg/kg DTX). At the end of experiment, (B) isolated tumors were weighed and (C) photographed. (D) Body weight changes and (E) survival rates were monitored. (F) Effects of different treatments on the inhibition of CAF growth by α-SMA staining (red), the induction of apoptosis by TUNEL staining (green), and the histological examination by H&E staining of tumor tissues. Blue signal derived from nuclei stained by DAPI (n = 5, * p < 0.05, # p < 0.01 vs. SP-DTX). Reprinted with permission from ref. [92]. Copyright 2016 American Chemical Society.

