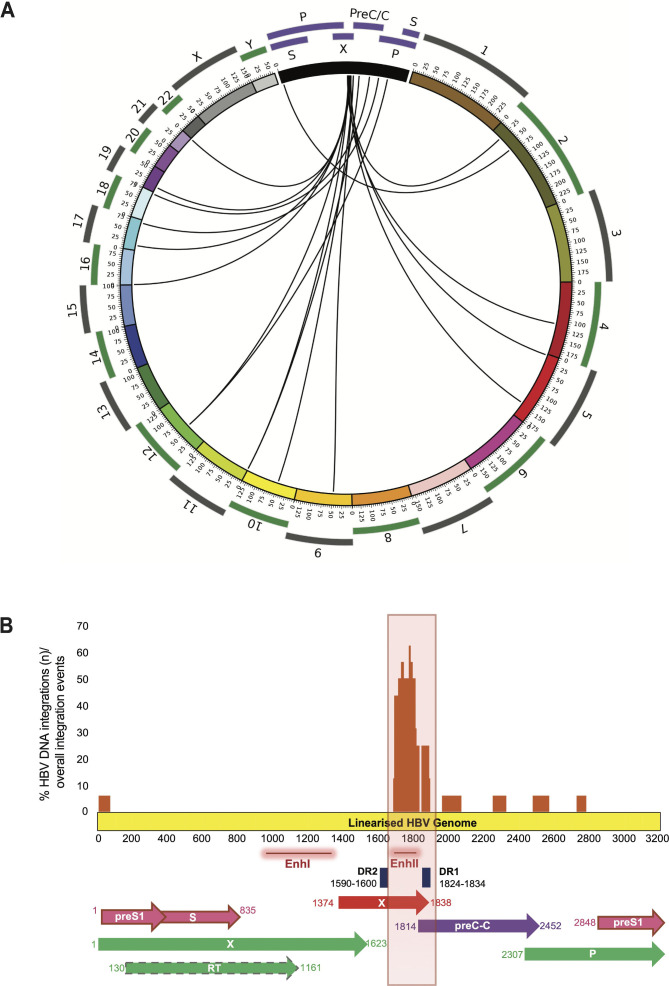
Figure 3.
Visualisation of HBV DNA integrations with regard to human chromosomes and the viral genome. (A) Each line defines HBV integration breakpoints at particular loci in the human genome (hg19). (B) The histogram reports the frequency of integration for each nucleotide position of HBV genome. The locations of the genes encoding HBV polymerase (green), core (violet), S (pink) and X (red) proteins are shown.

