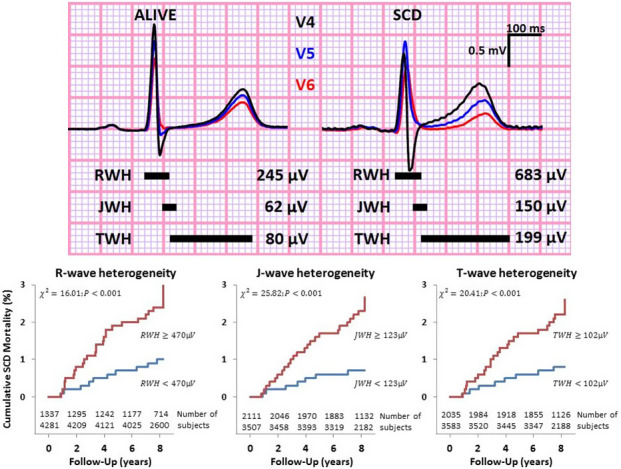
FIGURE 3.

Upper panel: Superimposed left precordial lead electrocardiograms (leads V4–V6) recorded in a survivor (left) and in a subject who suffered sudden cardiac death (SCD) (right) during the follow‐up period from Health Survey 2000 illustrate R‐wave heterogeneity (RWH), J‐wave heterogeneity (JWH), and T‐wave heterogeneity (TWH). Black horizontal bars indicate the periods when RWH, JWH, and TWH were measured. Lower panel: Kaplan–Meier curves of RWH, JWH, and TWH for SCD with numbers of subjects. Reprinted with permission from Kenttä et al. (2016)
