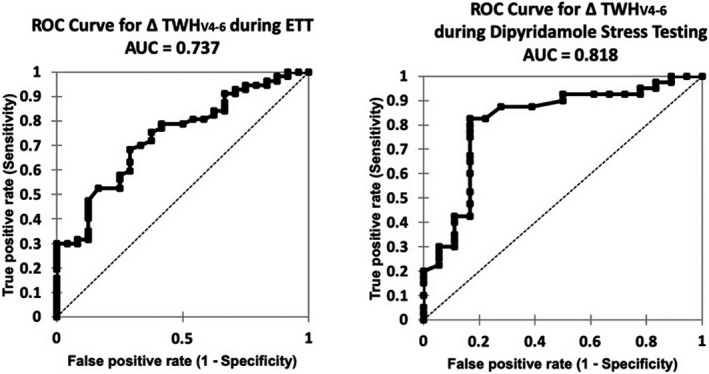
FIGURE 8.

Areas under the receiver operating characteristic curve (AUCs) for an increase in T‐wave heterogeneity in leads V4–6 (TWHV4–6) for clinically significant flow‐limiting coronary artery stenosis were 0.737 for exercise tolerance testing (ETT) (left panel) and 0.818 for myocardial perfusion imaging (MPI) with dipyridamole (right panel). ST‐segment changes with ETT and MPI with dipyridamole did not discriminate cases from controls. Reprinted with permission from Silva et al. (2020)
