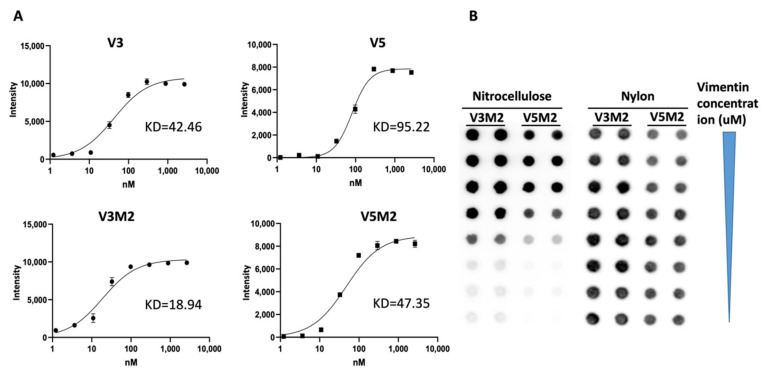
Figure 3.
The binding affinity of V3, V5, selected motifs and their equilibrium dissociation constant. Filter-binding assays were performed with the biotinylated V3, V5, V3M2, V5M2 thioaptamers and purified vimentin protein. Chemiluminescent detection of spot intensities on the nitrocellulose membranes was used to quantitate the thio-aptamer binding affinity. (A) Saturation binding curves were generated and the equilibrium dissociation constants, Kd, were calculated from the equation Y = Bmax × X/(Kd + X), assuming a single binding site. Bmax represents the maximum binding capacity of aptamer bound to vimentin protein. X is the protein concentrations and Y is the calculated spot intensity. (B) Representative spot image of biotinylated V3M2 and V5M2 binding with vimentin protein retained on the nitrocellulose membrane. Non-binding motifs stained on a nylon membrane.

