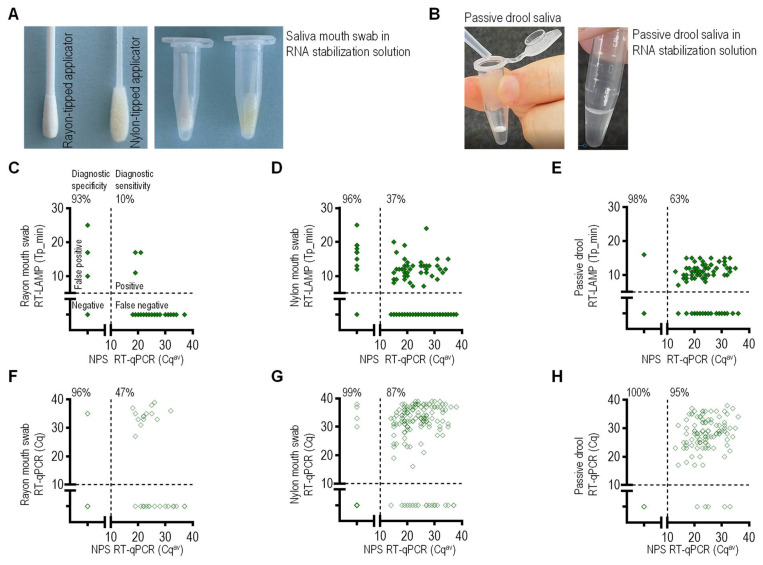
Figure 4.
Passive drool outperformed oral cavity swabs in SARS-CoV-2 detection. (A) Oral cavity swab applicators with rayon or nylon tips. The swab tip was saturated with saliva and placed in a microcentrifuge tube with RNA stabilization buffer (100 µL). (B) Three drops of saliva (~100 µL) collected as passive drool were mixed with 100 μL of RNA stabilization buffer. (C–E) RT-LAMP and (F–H) RT-qPCR performances on saliva samples collected in parallel with NPS specimens. Saliva samples were self-collected in the RNA stabilization buffer. (C–E) Tp values of RT-LAMP are plotted against the corresponding Cqav values of RT-qPCR for NPS. Cqav was calculated as an average of the E1 and RdRT Cq values. A rayon (C) or nylon swab (D) or passive drool (E) saliva sample (2 µL) was added to the reaction mixture for a total volume of 20 μL, and RT-LAMP amplified using WarmStart Mix and N2 primer set. (F–H) Saliva-based RT-qPCR Cq values are plotted against the corresponding Cqav of RT-qPCR for NPS. A rayon (F) or nylon swab (G) or passive drool (H) saliva sample (2 µL) was added to the reaction mixture for a total volume of 20 μL, and RT-qPCR amplified using Ultraplex Mix and N1 primer–probe set. Numbers above each plot indicate diagnostic specificity and sensitivity (for details, see also Supplementary Materials Table S5).

