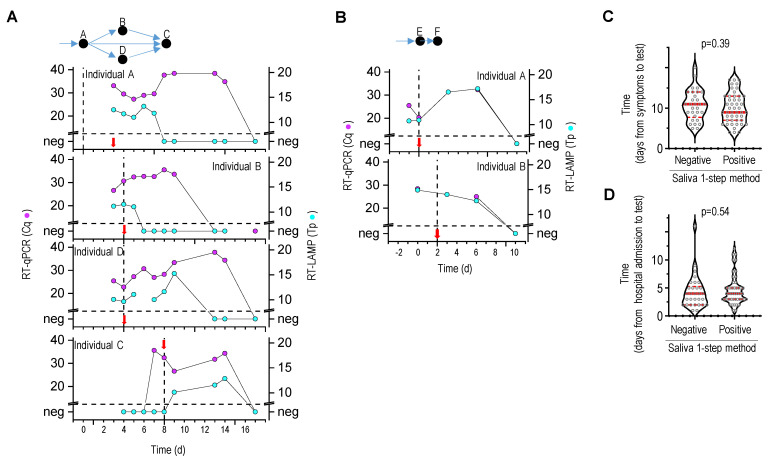
Figure 6.
Longitudinal analysis of SARS-CoV-2 virus in infected individuals and hospitalized patients. (A,B) Sequential saliva sampling and detection of SARS-CoV-2 infection. Two households are shown. The appearance of COVID-19 symptoms is marked with a vertical dashed line, and a red arrow indicates the day of a positive NPS-RT-qPCR test. The viral infection among individuals is schematically presented at the top. (C,D) Saliva collected from hospitalized COVID-19 patients was analyzed for the SARS-CoV-2 virus. Results grouped as positive and negative for SARS-CoV-2 in saliva are presented in relation to the time between symptoms or hospital admission and saliva tests. (A–D) Saliva samples were analyzed with saliva-based one-step RT-LAMP or RT-qPCR, and combined results were presented.

