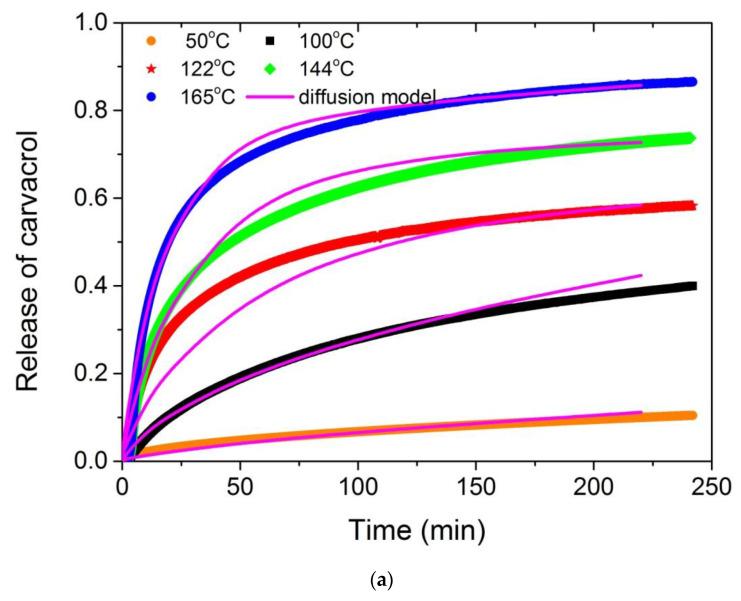
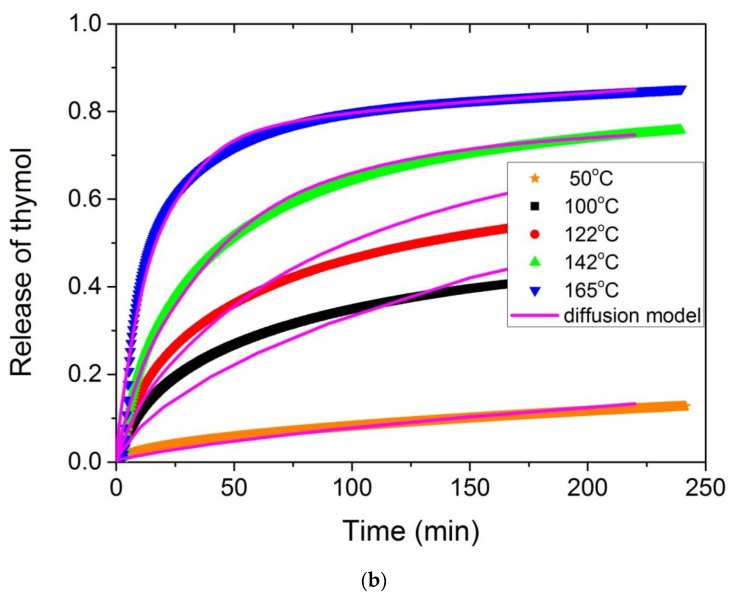
Figure 11.
Comparison of the simulation results obtained from the combined diffusion model (Equation (10)) and the best-fit parameters shown in Table 4, to the normalized isothermal TGA experimental data plotted in the form of Mt/M∞ and obtained at different temperatures, for carvacrol (a) and thymol (b).


