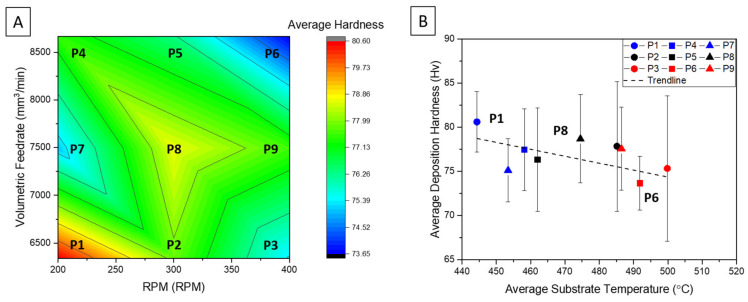
Figure 2.
(A). Color contour plot contrasting the material volumetric feed rate to the RPM of the tool. (B) Deposition cross-sectional hardness versus average temperature. Key: circles correlate to 200 RPM, squares to 300 RPM, and triangles to 400 RPM. Blue data points correlate to deposition ratio of 0.55, black data points correlate to a deposition ratio of 0.65, and red data points correlate to a deposition ratio of 0.75.

