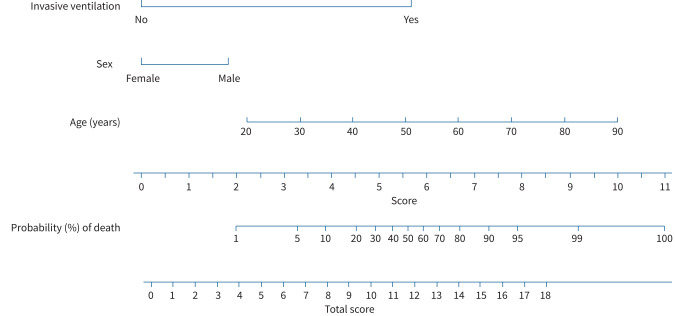
FIGURE 2.
Nomogram for the estimation of the risk of death, generated on the basis of the multivariable logistic regression analysis. As depicted, each indicator is measured, and the corresponding points are assigned using the row “score”. Thus, the sum is reported on the row “total score”, and the corresponding probability of the outcome is identified in the row “probability (%) of death”. As an example on how to use this nomogram, an 80-year-old woman not requiring invasive ventilation would have a probability of death <20%. In contrast, an 80-year-old woman requiring invasive ventilation during hospitalisation would have a probability of death >80%.

