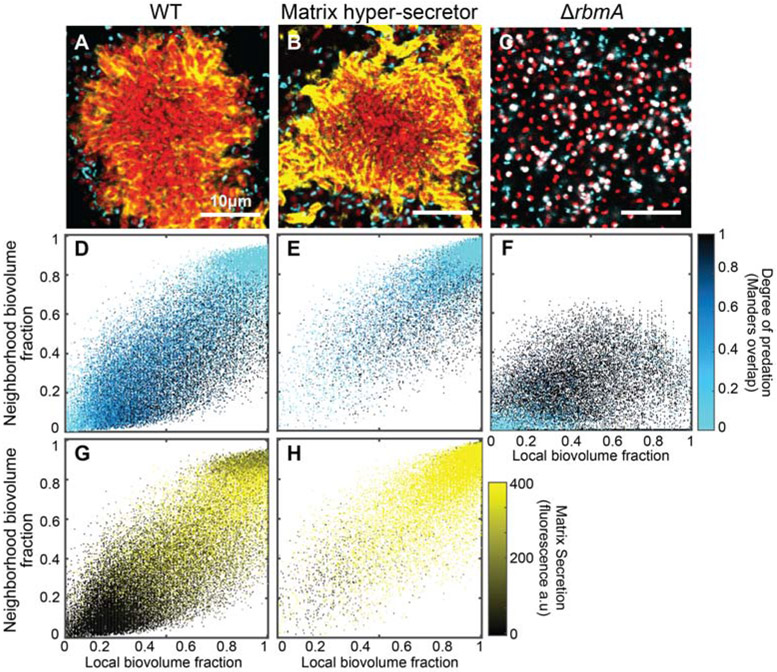
Figure 2. A critical threshold of neighborhood biovolume fraction correlates with prey cell protection from predation.
(A-C) Images of V. cholerae biofilm clusters of wild type, matrix hyper-secreting, and ΔrbmA strains 2 h after predator introduction. V. cholerae cells are shown in red, B. bacteriovorus is shown in cyan, and immunostained RbmA-FLAG matrix protein is shown in yellow. Biofilms were segmented and analyzed by dissecting the total system into a cubic grid as detailed in the main text. The segmented biovolumes in each grid unit were analyzed individually to produce the heatmaps described below. (D-F) Heatmap plots for the degree of predation in biofilms of the three strains shown in (A-C), respectively (n = 6 for each strain). The horizontal axis denotes local biovolume fraction, and the vertical axis denotes neighborhood biovolume fraction. Light blue points correspond to biofilm volume units that are protected from predation; dark blue points denote areas with predation initiating at the cell exterior; and black points denote areas fully predated. Note the critical threshold neighborhood biovolume fraction of approximately 0.8 above which biofilms are protected from predation in (D,E). (G-H) Heatmaps plots for RbmA matrix accumulation in biofilms of the two strains shown in (A-B), respectively (n = 6 for each strain). There is no entry for the ΔrbmA strain, because it cannot produce the matrix protein being immunostained. Axes are as for (D-F). The black-to-yellow scaling relates the matrix accumulation for each point. Note in comparing (E) and (H) in particular that high matrix production by itself does not confer predator protection; rather matrix-replete regions of the biofilm must first reach the critical neighborhood cell packing threshold before predators are spatially exluded. See also Figure S2, Table S1, and Table S2.

