
Fig. 4.
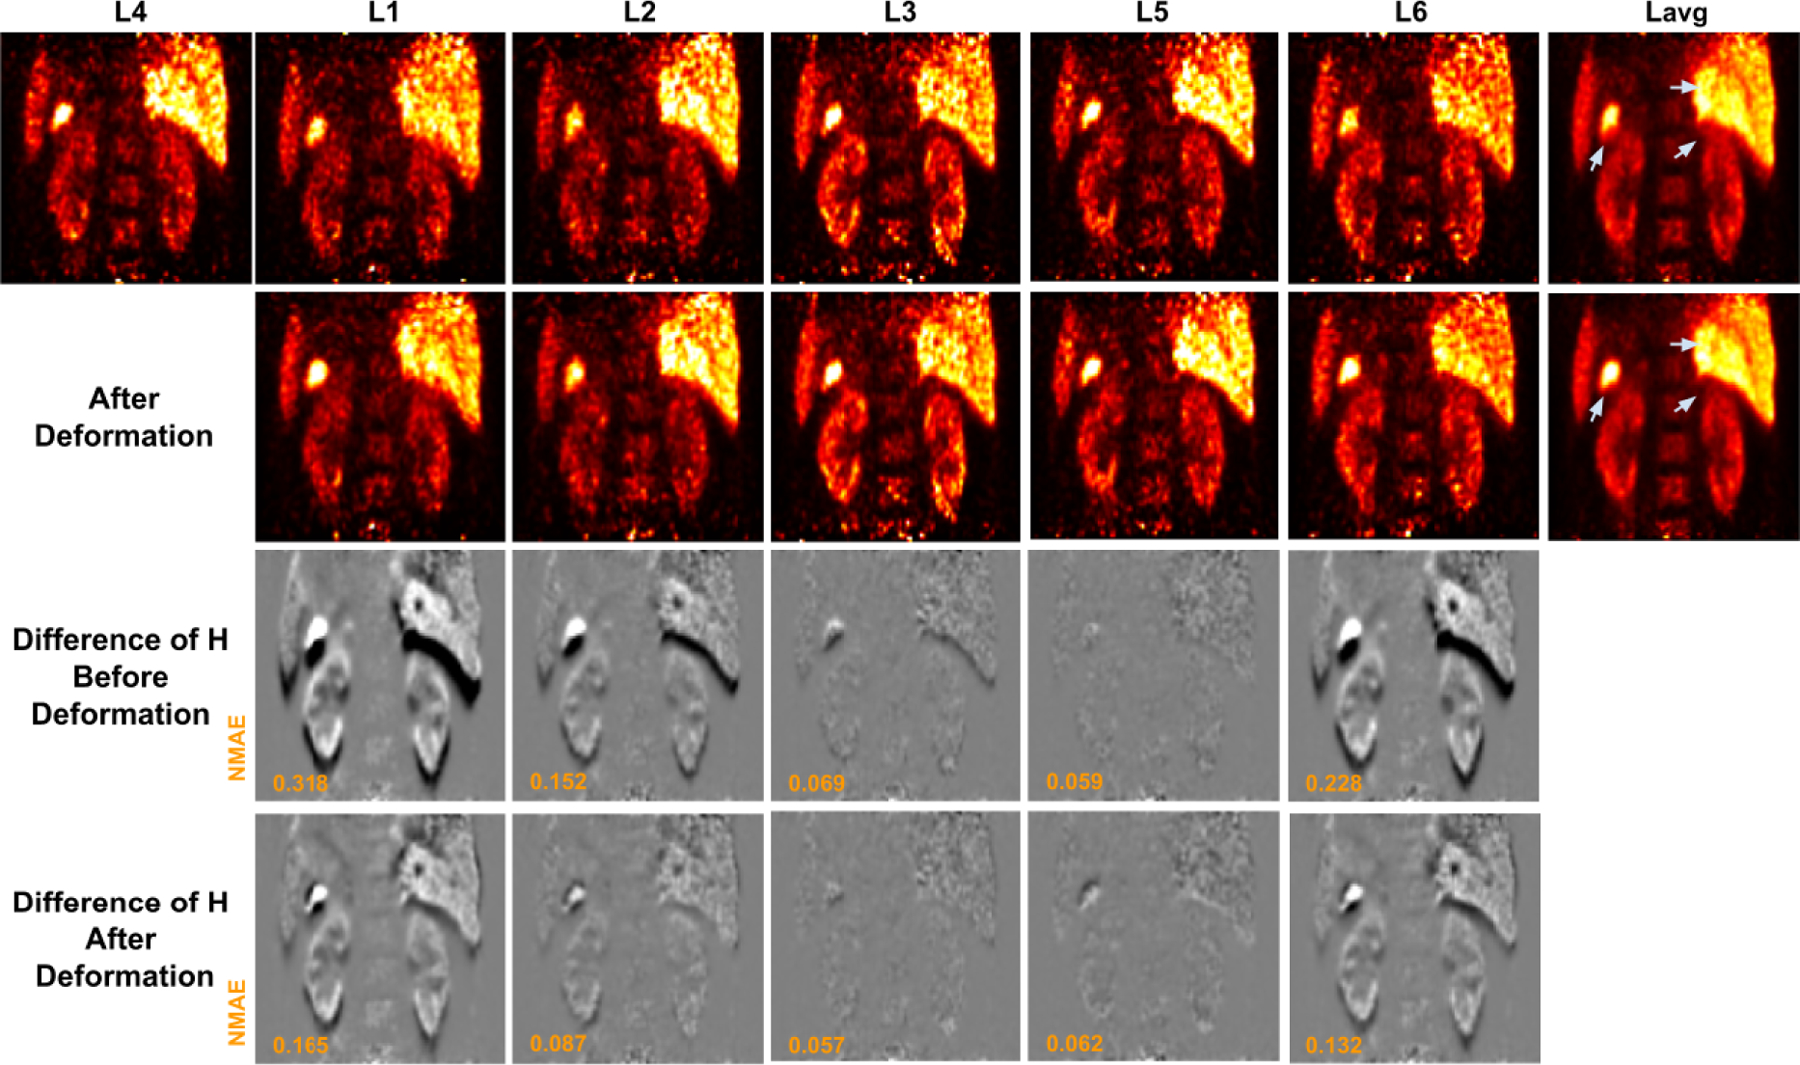
Low-dose gated image before and after deformation by our MDPET. The unregistered low-dose gated images Ln and the corresponding averaged image Lavg are shown in the 1st row. The deformed low-dose gated image Ln and the corresponding averaged image Lavg are shown in the 2nd row. The predicted transformations are applied to the corresponding high-dose gated images Hn, where the difference of H between reference gate and source gate are visualized. The difference of H before and after registration over all gates are shown in the 3rd and 4th row, respectively. The motion blurred regions are indicated by gray arrows.